

Using The App
The web app at app.buildnote.io is where collected events become something you can read: pipeline timelines, test history, dashboards, and an assistant that answers questions about your data in plain English.
This section walks through the app screen by screen. Start here for the shared mechanics of navigation, teams, and the time range. Then follow the page that matches what you want to do.
Signing in and choosing a team
You sign in with GitHub, GitLab, Google, email and password, or your organisation's SAML provider. See User Management for the full authentication flow.
Everything in the app belongs to a team. Your account is created as Billing Manager of a new team, and you can belong to as many teams as you need. Each team has its own data, integrations, members, and bill.
The account menu at the foot of the left navigation switches between your teams, each listed with the role you hold there, and creates new ones with Add team. The team identifier is part of every URL, so links you share always open in the right team.
The left navigation
Five destinations sit in the sidebar, and which ones you see depends on your role and your team's plan. The panel icon next to the page title collapses the navigation to an icon rail when you want the width for a wide table or a dashboard.
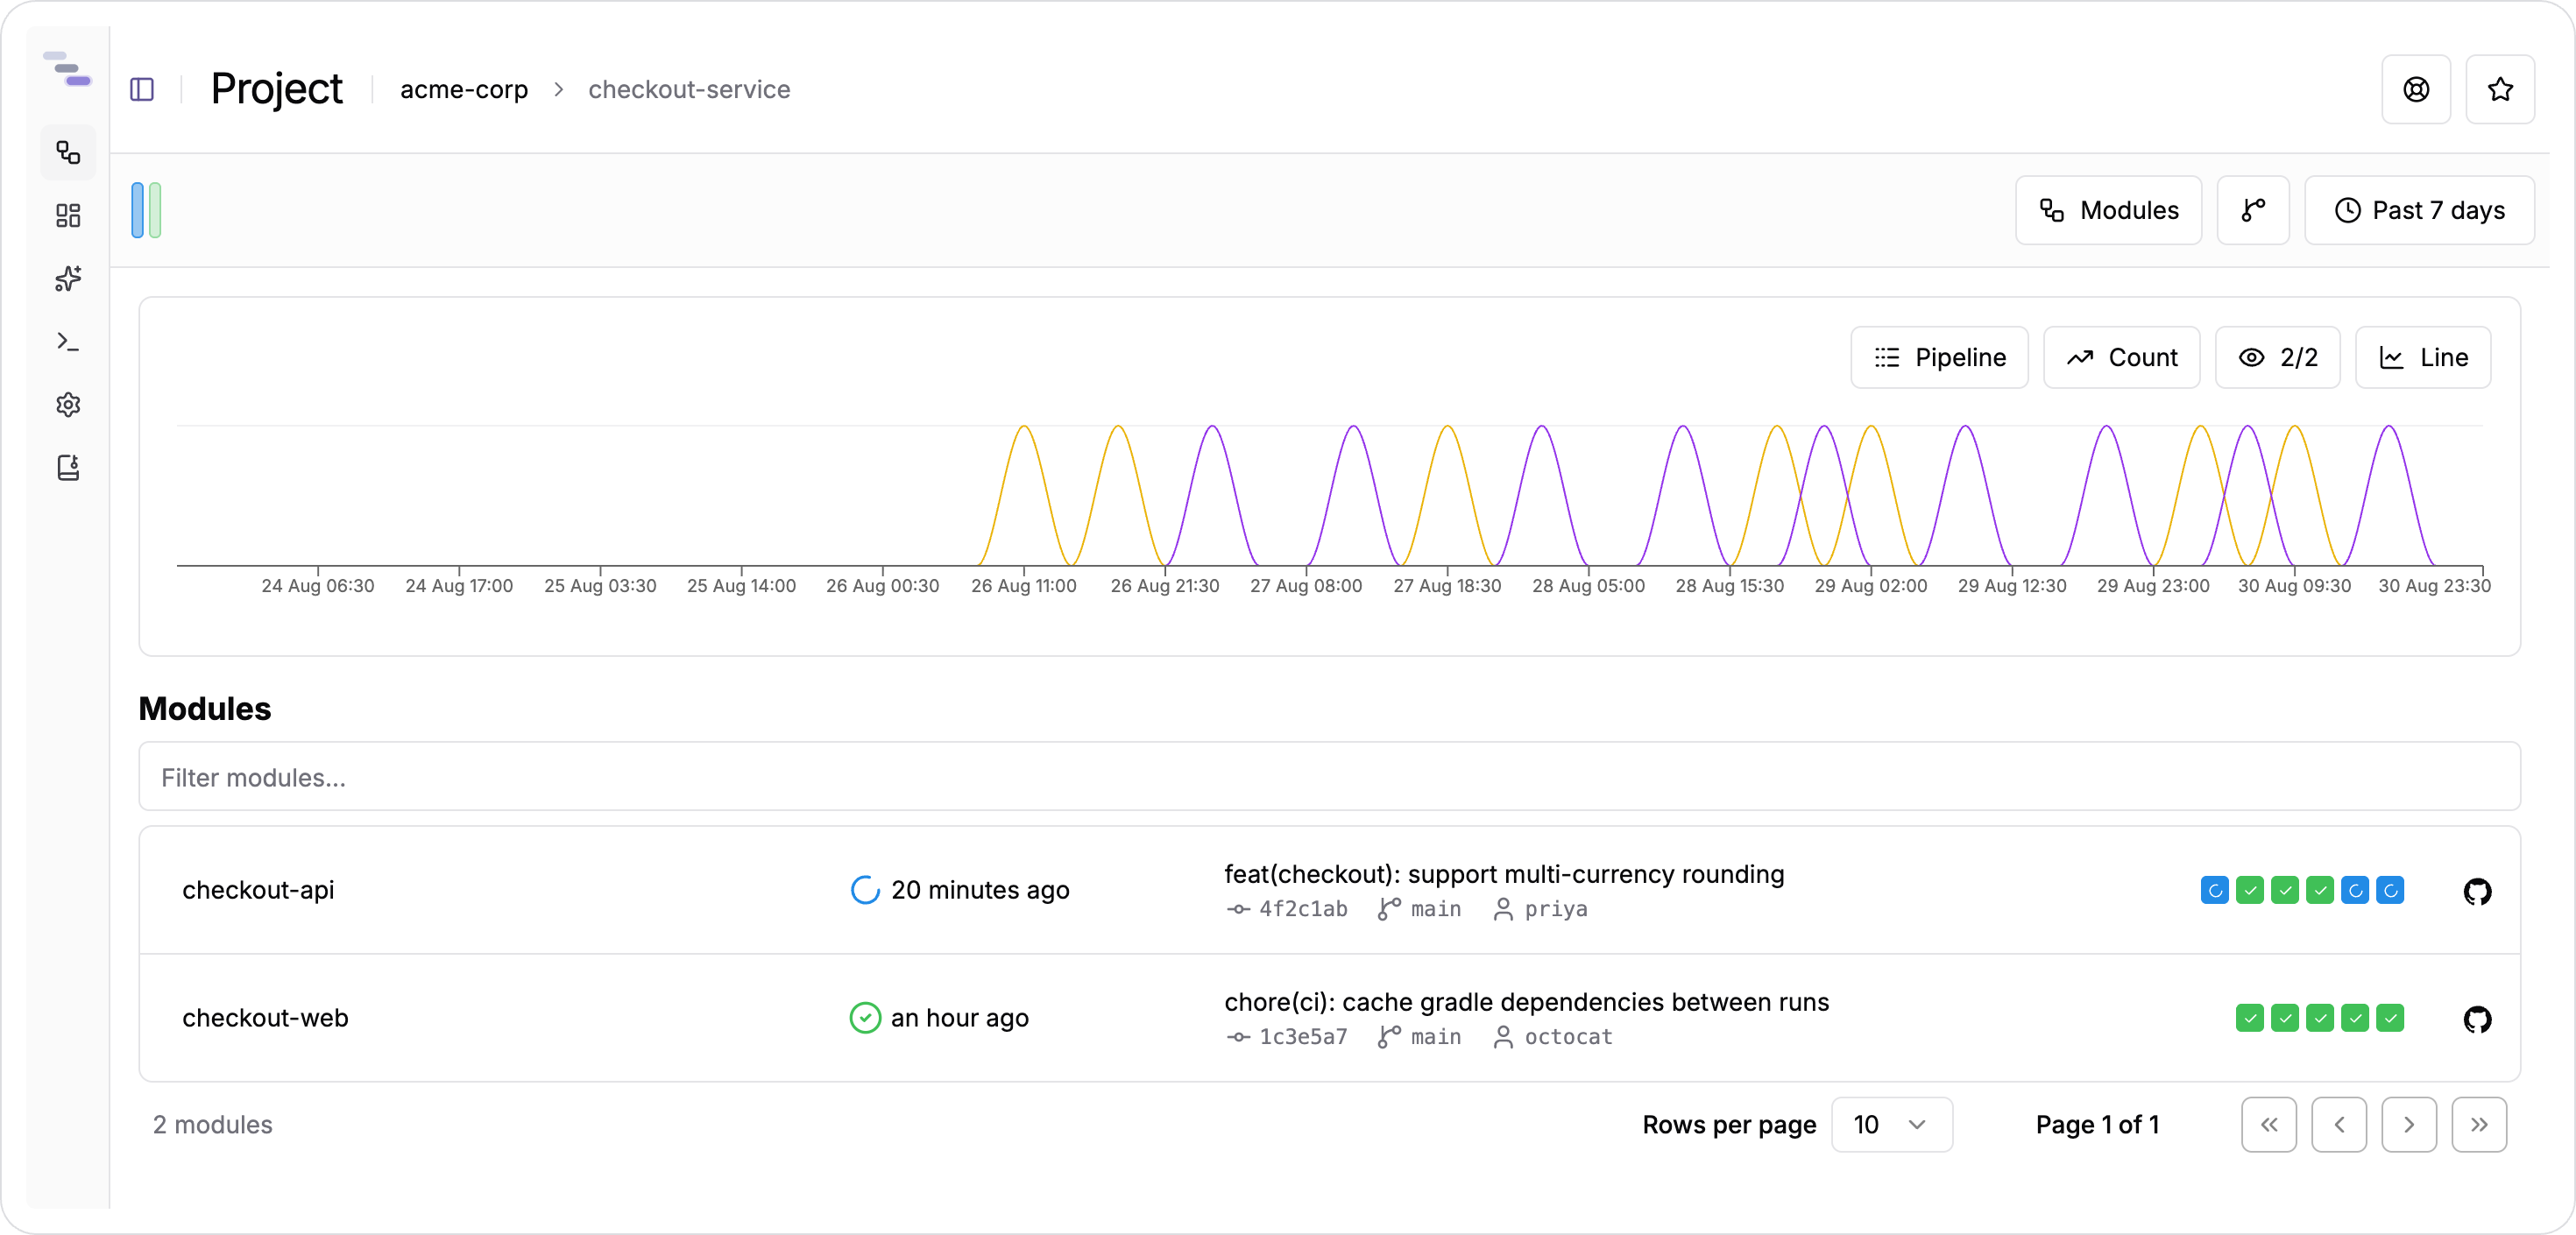
Builds is the default view and the entry point for exploring collected events, from organisations down to a single test case. Start here when something is red and you want to know why.
Dashboards holds the boards your team builds from saved queries, for the numbers you want to see without asking for them.
AI Insights is the assistant. You ask a question in plain English and get an answer with charts, dashboards, files, or a build timeline rendered inline.
Query is a raw query editor, for when you know exactly what you want and would rather write it than describe it.
Settings groups team configuration: general, users, security, integrations, notifications, and billing.
The time range
Most pages carry a time-range control in the header. It applies to everything the page loads: build lists, stability graphs, event tables, dashboard widgets, and query results.
Presets cover Today, This week, This month, This year, and rolling windows from Past 8 hours through Past year, plus Max. You can also pick an explicit from-and-to range. The default is the past 7 days.
The selected range lives in the URL, so a link you paste into a pull request or a chat message reproduces exactly what you were looking at. The same is true of most filters, including branch, status, and event type, and of which file or tab you had open.
The one page without a time filter is the assistant, which takes its window from the question you ask.
Breadcrumbs and bookmarks
Breadcrumbs across the top of every detail page trace the path from team to organisation, project, module, build, and event, and each level is clickable.
Organisations, projects, and modules carry a bookmark button. Bookmarking one adds it to a list in the left navigation, so the handful of modules you actually watch are one click away instead of four.
What your role and plan allow
Three roles exist. Members with the User role read builds and events, use dashboards and the query editor, and configure notifications. Admin adds member management, integrations, API keys, renaming and deleting the team, and plan and usage visibility. Billing Manager adds everything to do with money: changing plan, payment methods, subscription details, and invoices.
Plans gate features as well as volume. On the Free plan, events arrive only through a version control integration such as the GitHub app, retention is 14 days, and the daily event ceiling is 25,000. The query editor, dashboards, API keys, notifications, and the AI features are not part of that plan. Pro and Enterprise plans unlock all of those, retain events for 400 days, and raise the ceiling to a million events a day.
Where to next
Read Exploring Builds for the event explorer, from the list of organisations down to a single failing test and the files its build collected. Read AI Insights for the assistant and for the failure summaries that appear on events. Read Dashboards for building boards, Query for the editor, Guardrails for the rules your pipeline runs and the verdicts they leave on a build, and Team Settings for members, integrations, notifications, and keys.