

Dashboards
A dashboard is a saved board of widgets, each driven by its own query. Use one to keep the numbers your team looks at every morning in one place instead of re-deriving them: pipeline duration, failure rate, flaky tests, storage growth.
Dashboards are available on plans that include API and query access. Team members with any role can build and edit them.
Finding and creating boards
Dashboards in the left navigation lists the boards your team has saved, with a search box for finding one by name.
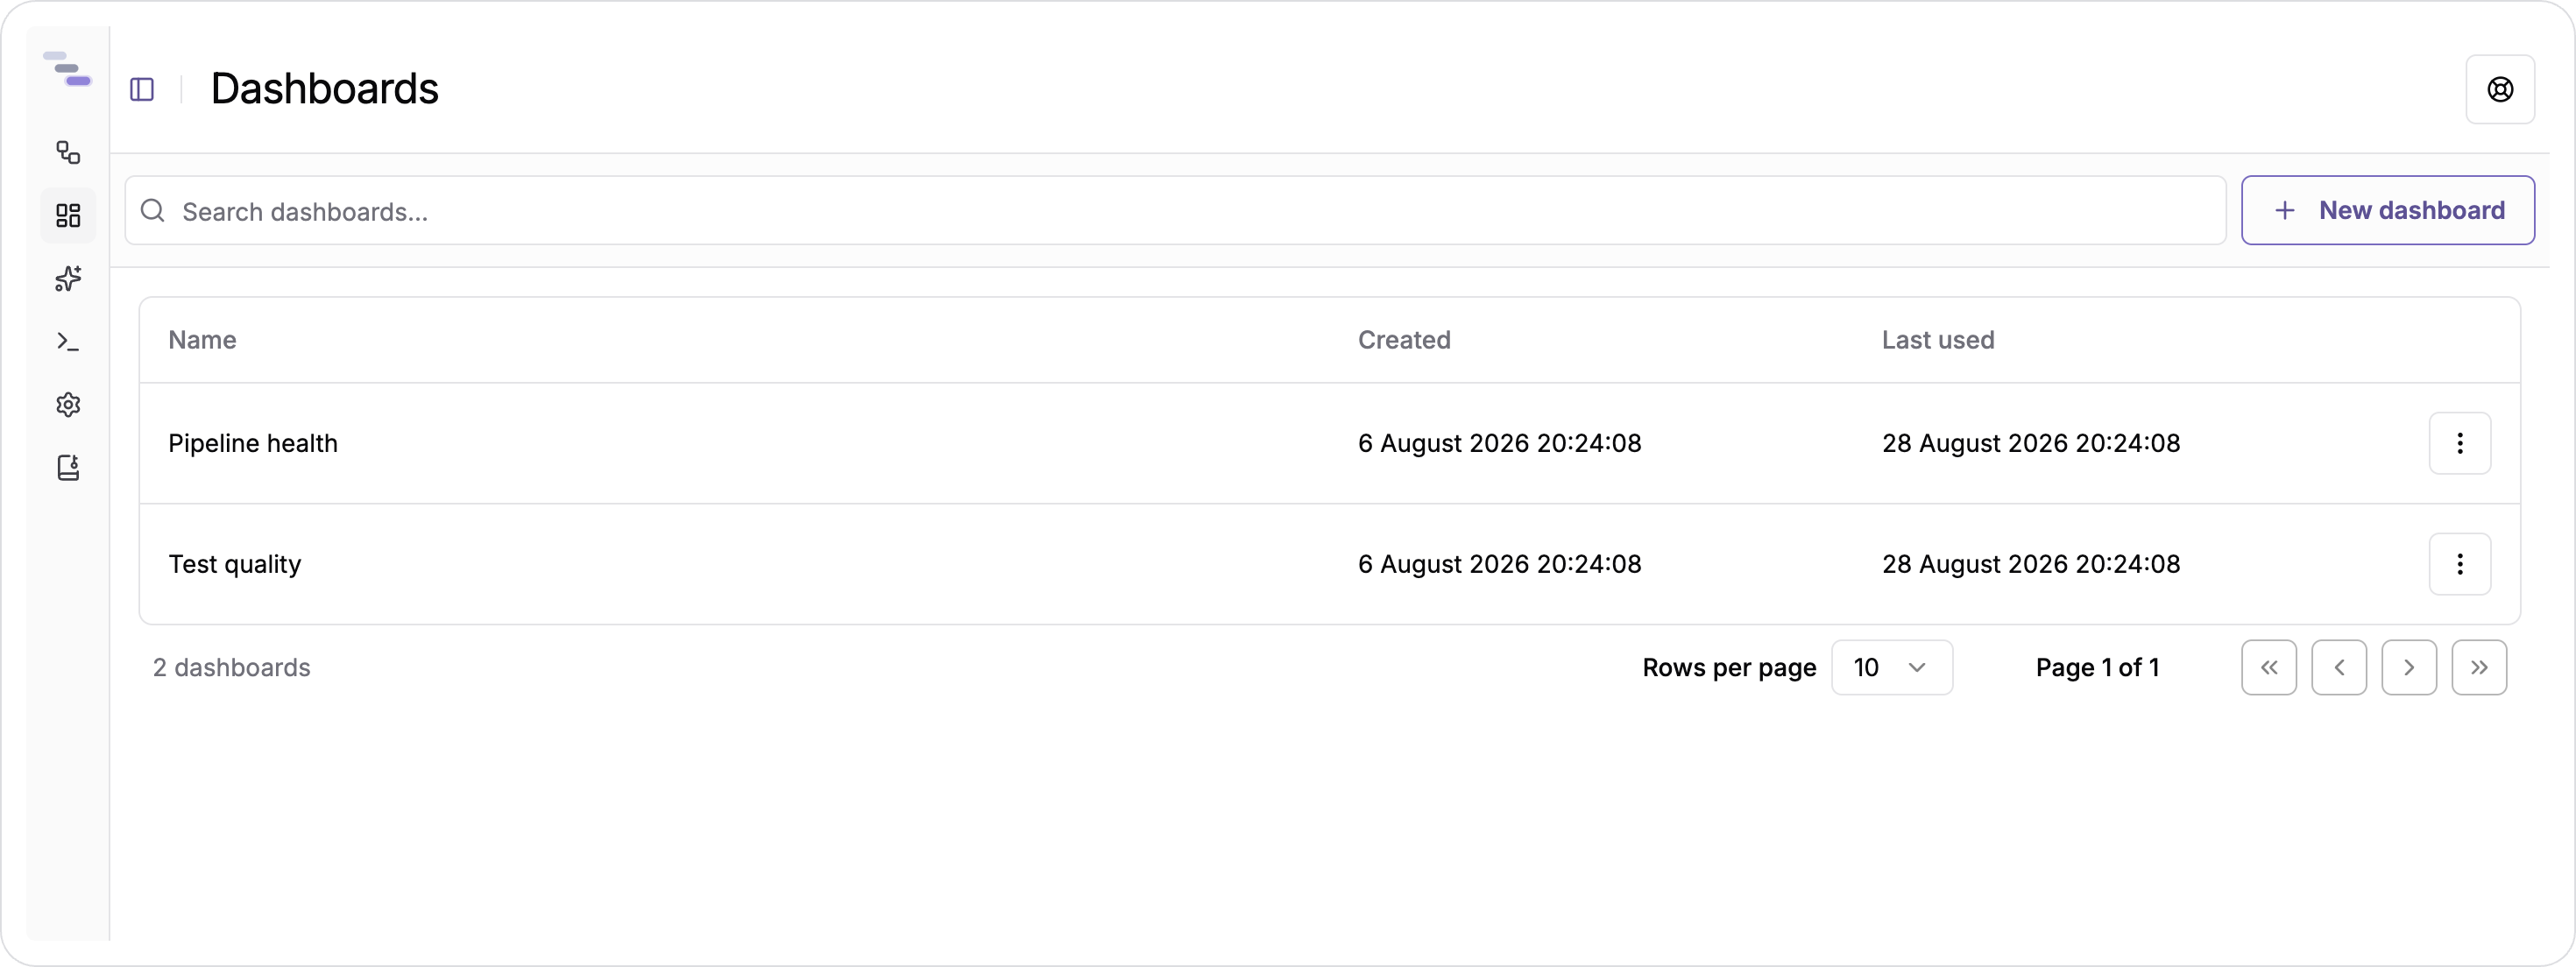
New dashboard asks for a name and opens the empty board, which prompts you to add your first widget. A board is read-only until you press Edit, which is what stops an accidental drag from rearranging a shared view.
The editing surface
Edit mode turns the board into a grid and opens the properties panel on the right.
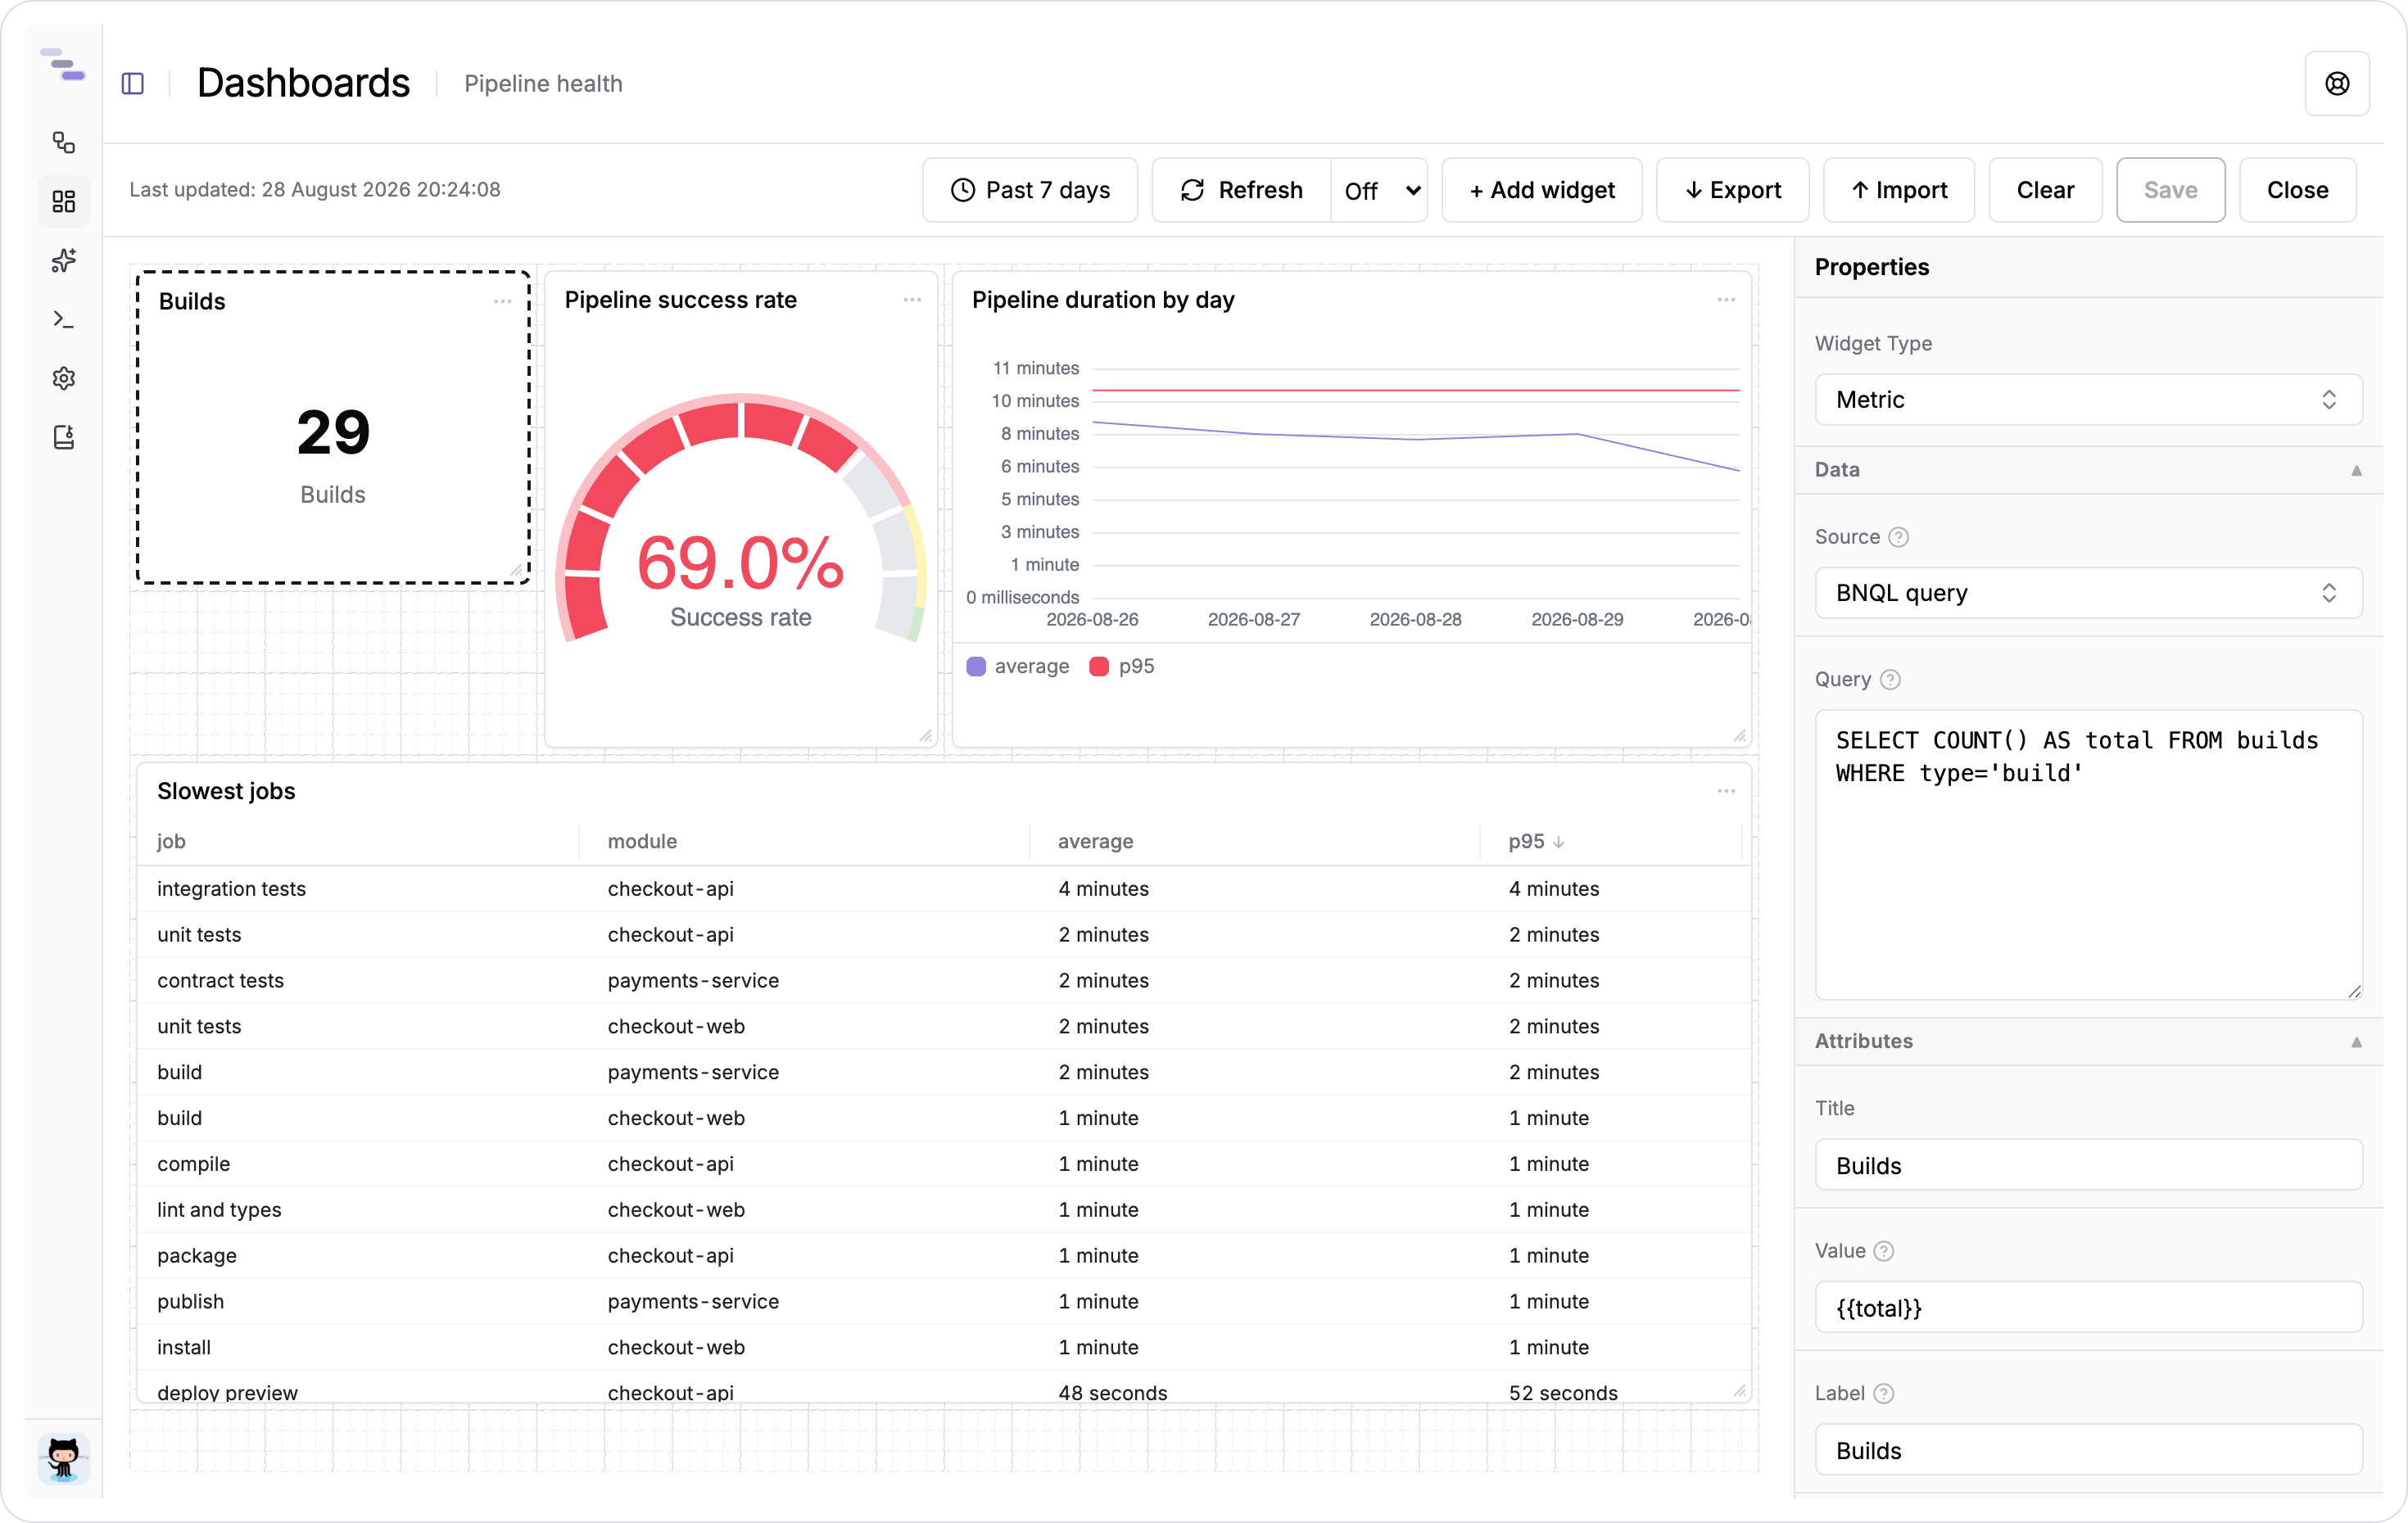
The toolbar across the top holds everything that acts on the board as a whole: the time range, a manual Refresh, the auto-refresh interval, Add widget, import and export, Clear, and Save. Closing edit mode with unsaved work prompts you before discarding it.
Adding and arranging widgets
Add widget offers a searchable list of the five widget types.
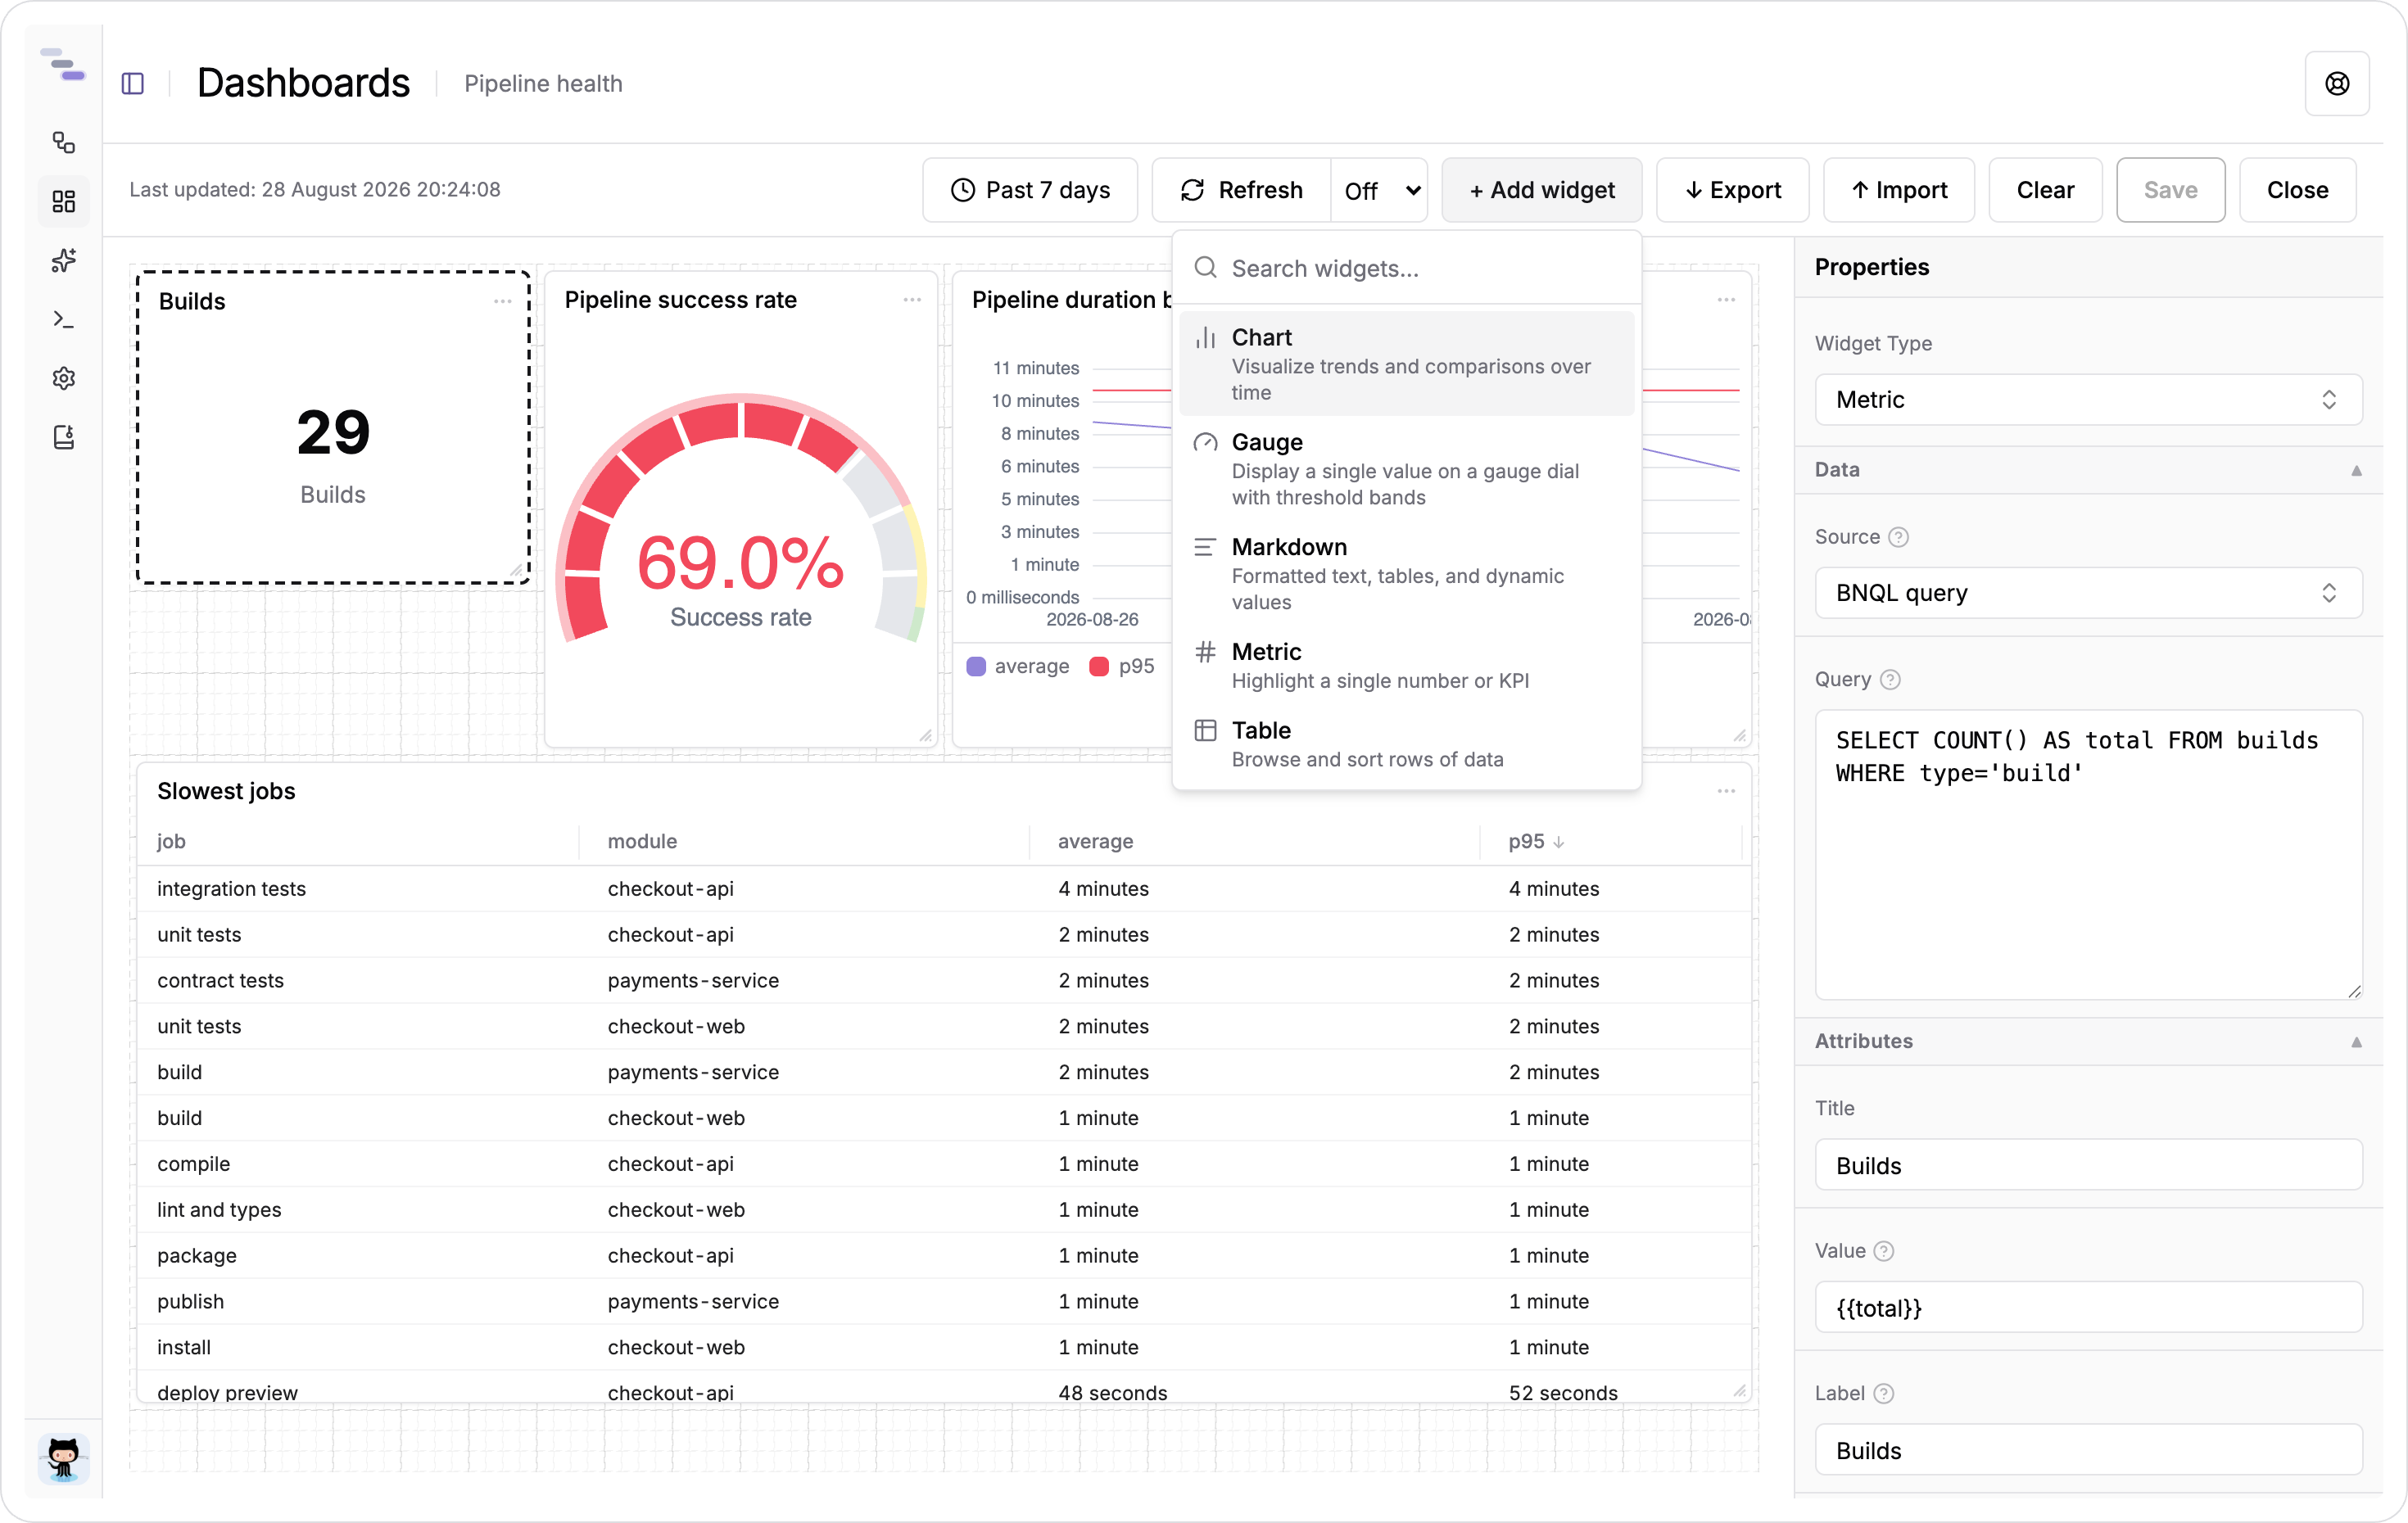
A chart plots trends and comparisons over time, in line, bar, or pie form. A table shows row detail, with resizable columns. A metric displays a single number, and a gauge displays one value against thresholds you define. A markdown widget holds prose, links, and headings, which is useful for explaining what the board is for or linking to a runbook.
Widgets sit on a 24-column grid. Drag to move, drag an edge to resize, and the board compacts around what you place. The properties panel on the right always edits the selected widget, which is the first one on the board when you enter edit mode.
Configuring a widget
The properties panel has three parts. Widget Type and Title are the identity of the widget. Data holds the source and the query that feeds it, written in the query language documented in the BNQL reference. Attributes are the presentation settings for the type you chose: chart type and data format for a chart, thresholds and style for a gauge, the value template and unit for a metric, and so on.
Widgets are normally driven by their query rather than by embedded values, so a saved board reflects live data. To change what a widget shows, change its query. A widget can also be fed inline values or nothing at all, which is what a static markdown panel uses.
Charts and tables support per-field overrides. Add a field by name and then set only the properties you care about for it: colour, unit, whether it plots, tooltip behaviour, column width, visibility, or thresholds. That is how you make failures red without recolouring the whole series, or format one column as a duration and another as a percentage.
Units come from a shared catalog covering data sizes, durations, throughput, currency, temperature, dates, and more, so a value rendered as 2h 5m or 1.4 GB needs no formatting logic in your query. Typing a unit that is not in the catalog uses it as a literal suffix.
Time range and refresh
The board's time-range control supplies the window for every widget query, which is why widget queries generally leave their own bounds out. Change the range and the whole board re-reads.
Refresh re-runs every query on demand. Next to it sits an auto-refresh interval, which can be off or set from five seconds up to a day, so a board stays live on a wall display.
Saving, importing, and exporting
Save writes the layout, widget configuration, and refresh interval back to the team. Clear removes every widget from the board.
Export downloads the whole dashboard as JSON, and Import loads one back. Use that pair to copy a board between teams, keep a template in version control, or share a layout with another team.
The AI Insights assistant can also compose a whole dashboard from a question and save it here with one click, which is usually the quickest way to get a first draft on the screen.