

AI Insights
Two AI features run against your collected data. Failure summaries explain a broken test or step in a sentence or two, on the event page, without you asking. AI Insights is a chat: you ask a question in plain English and the assistant queries your data, then answers with live charts, whole dashboards, collected files, or a build's pipeline timeline rendered directly in the conversation.
Both read the same events the rest of the app reads. Nothing is sent anywhere until you enable the feature and connect a model provider.
Turning AI on
Three things need to be in place.
Your team needs a plan that includes the AI features, which means Pro or Enterprise. Then, under Settings → General → Event Collection, switch on AI Insights ("Use AI to gain better insights (e.g. summarise failures or detect flaky tests)"). Admins and Billing Managers can change this switch; everyone else sees its state.
Finally, connect a model provider under Settings → Integrations. Anthropic, Google Gemini, and OpenAI are supported, each with its own step by step guide. Creating one asks for an integration name, the provider API key, and the model to use, with the current models offered in a dropdown and the recommended one first. The key is stored encrypted and used only for your team's requests. Changing model later is a matter of editing the integration; nothing else in the app needs to change.
AI requests are billed on top of your plan, and every reply reports exactly what it cost. Pricing detail for each plan is on the pricing page.
Failure summaries
With AI enabled, failed test and build events are summarised as they arrive. Open a failed event and the status panel opens on the summary rather than the raw output: what failed, the likely reason, and the category of failure. The original message and stack trace remain a click away.
This is triage rather than diagnosis. A summary tells you quickly whether a red build is an infrastructure blip, a genuine regression, or an unstable test, so you know whether to interrupt what you are doing. See Exploring Builds for where the panel sits on an event.
Asking a question
Open AI Insights from the left navigation and type a question into the box at the bottom. For example:
Which test suites failed most often this week?
Why was the last main-branch build so slow?
Show me the coverage report from the most recent release build.
Build me a dashboard of pipeline duration and failure rate by project.Send with the button or ⌘↵ (Ctrl+↵ on Windows and Linux). While the assistant works, its progress is shown step by step; the Stop button ends the run immediately if you asked the wrong thing.
The assistant does not guess at your schema. It loads the query-language reference, drafts a query, validates it, runs it against your events, and corrects itself when a query comes back wrong. That is why a reply takes a few rounds rather than arriving instantly.
Ask for the period you care about in the question ("last month", "since Monday"). The chat has no time-range control of its own, and unless you say otherwise the assistant looks at the past week.
What comes back
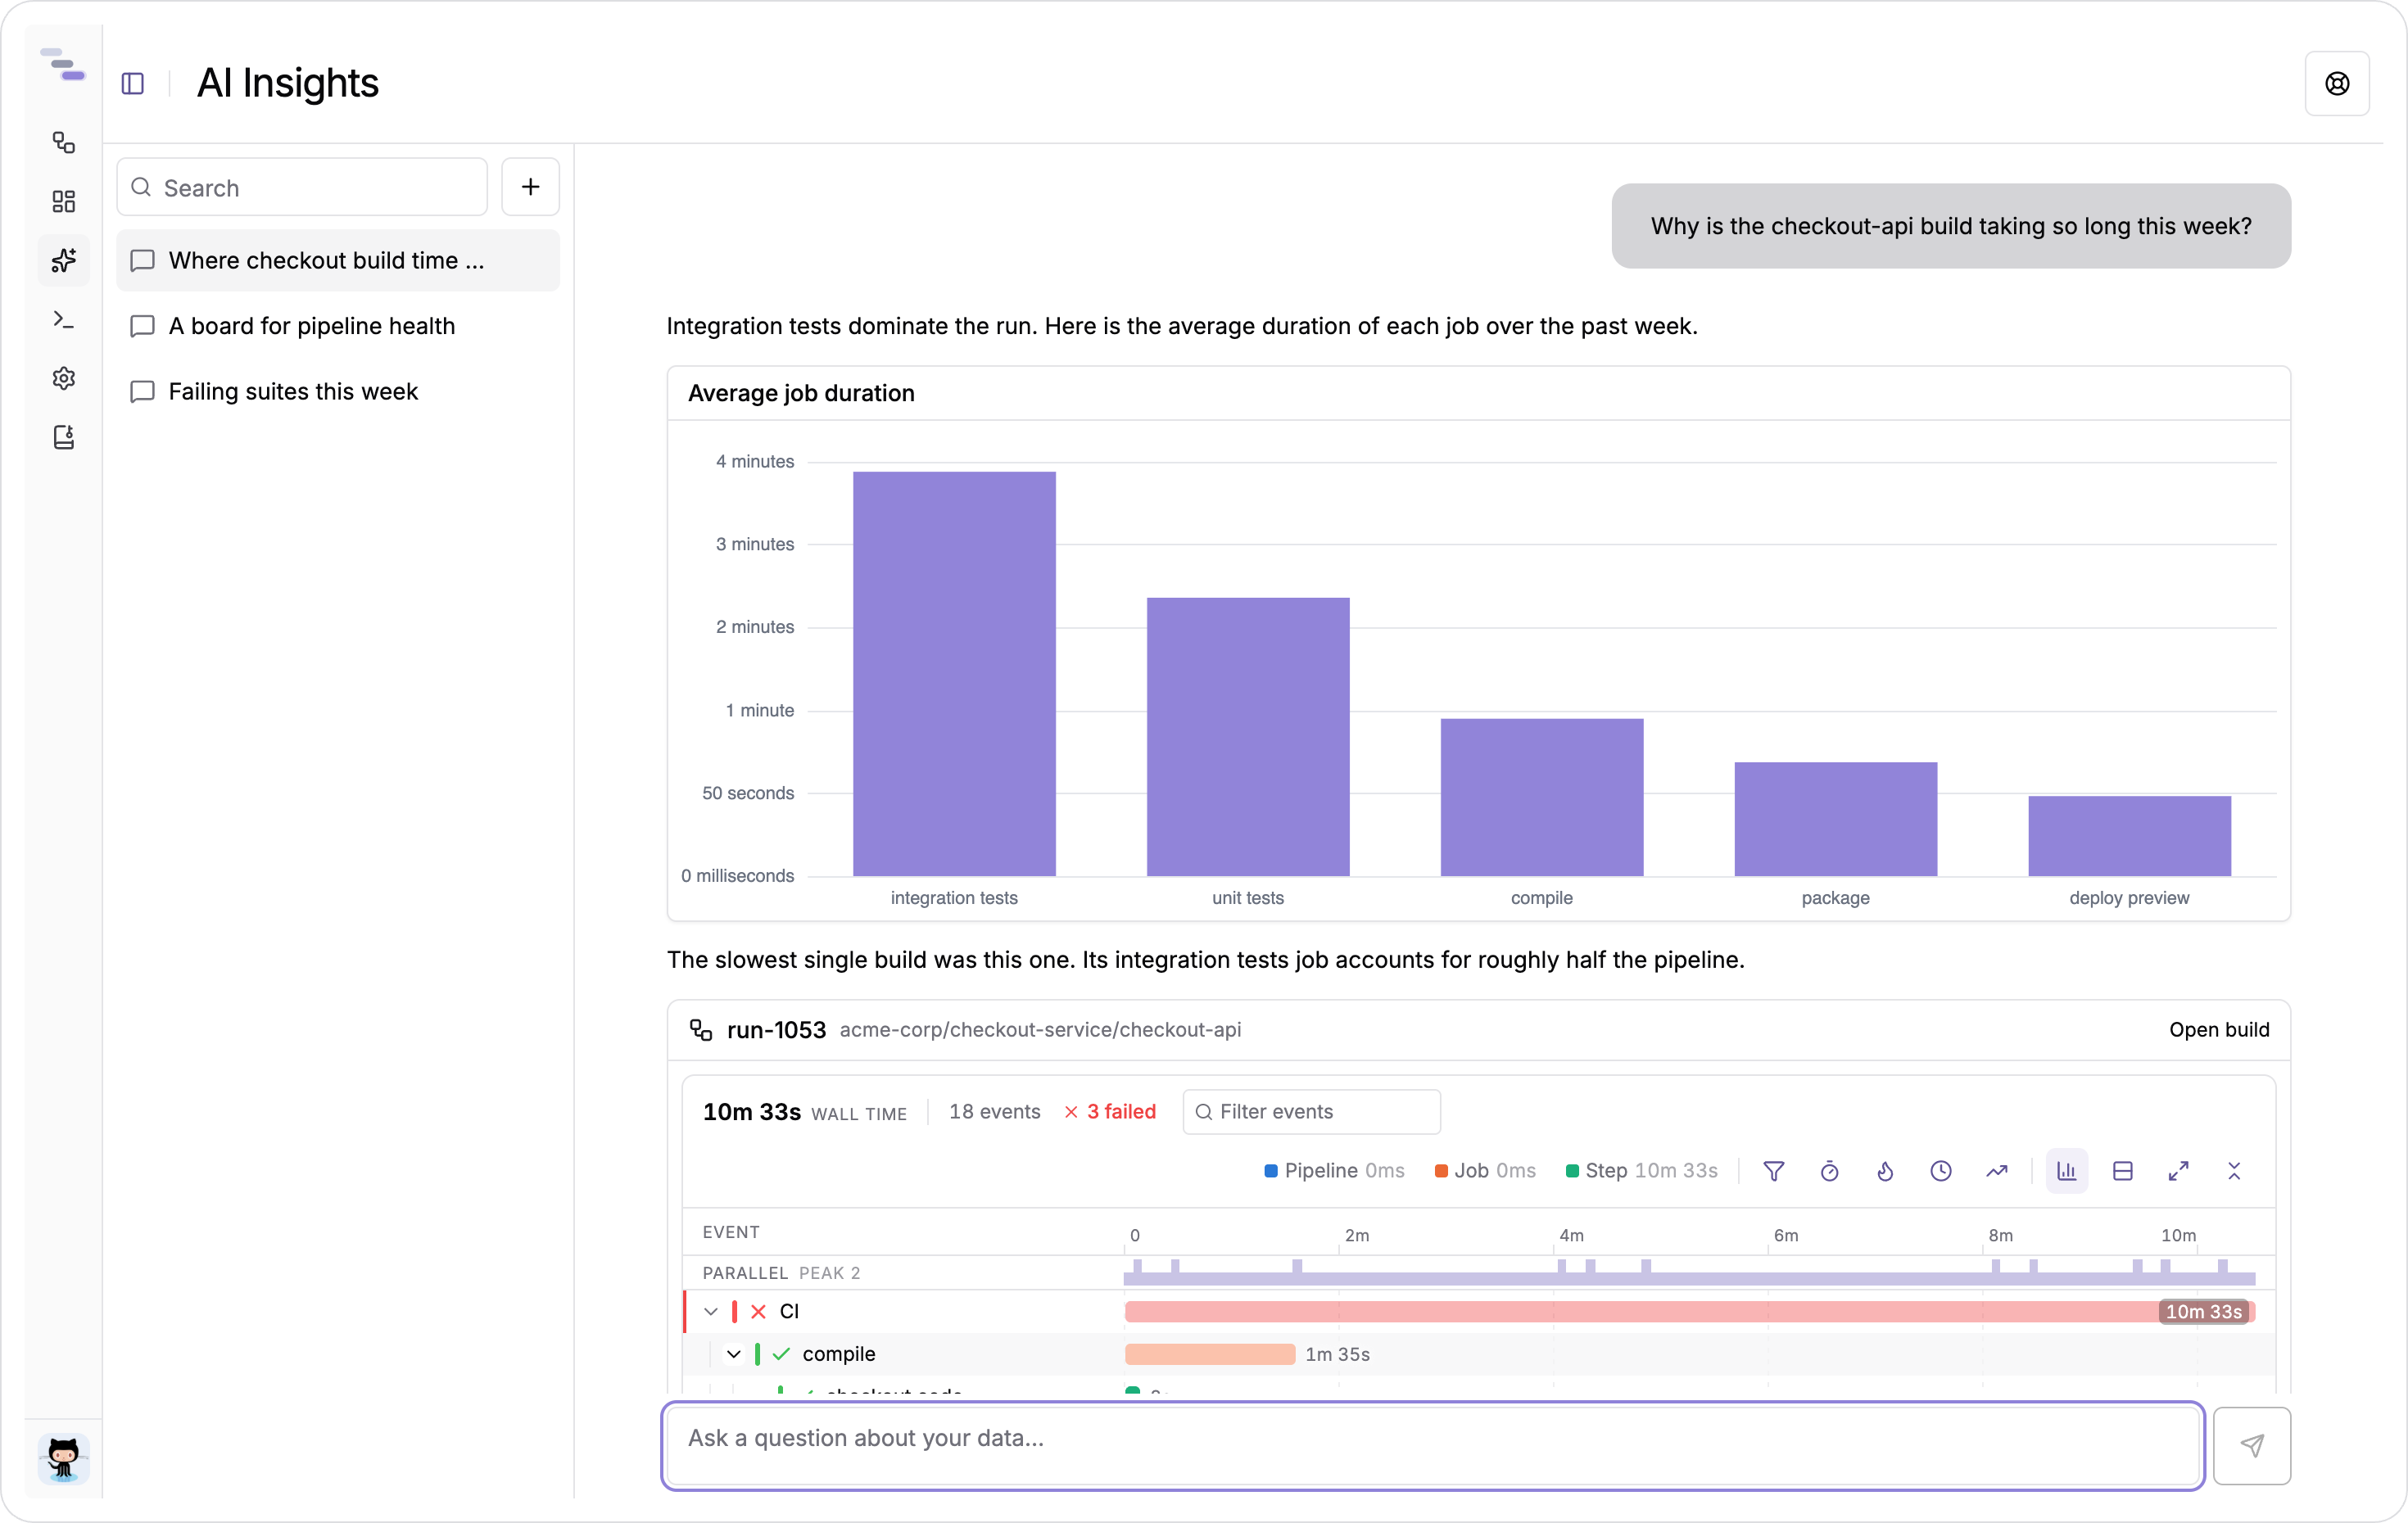
Replies interleave prose with rendered content, in the order the assistant produced it, so a chart always sits under the sentence that introduces it.
Charts, tables, metrics, gauges, and markdown panels are live. Each one carries the query that produced it and runs against your data when the message renders, so reopening an old conversation shows current numbers rather than a stale picture.
Dashboards arrive as a whole board when you ask for one. Several widgets come back already laid out on the grid, shown read-only exactly as they would look once saved.
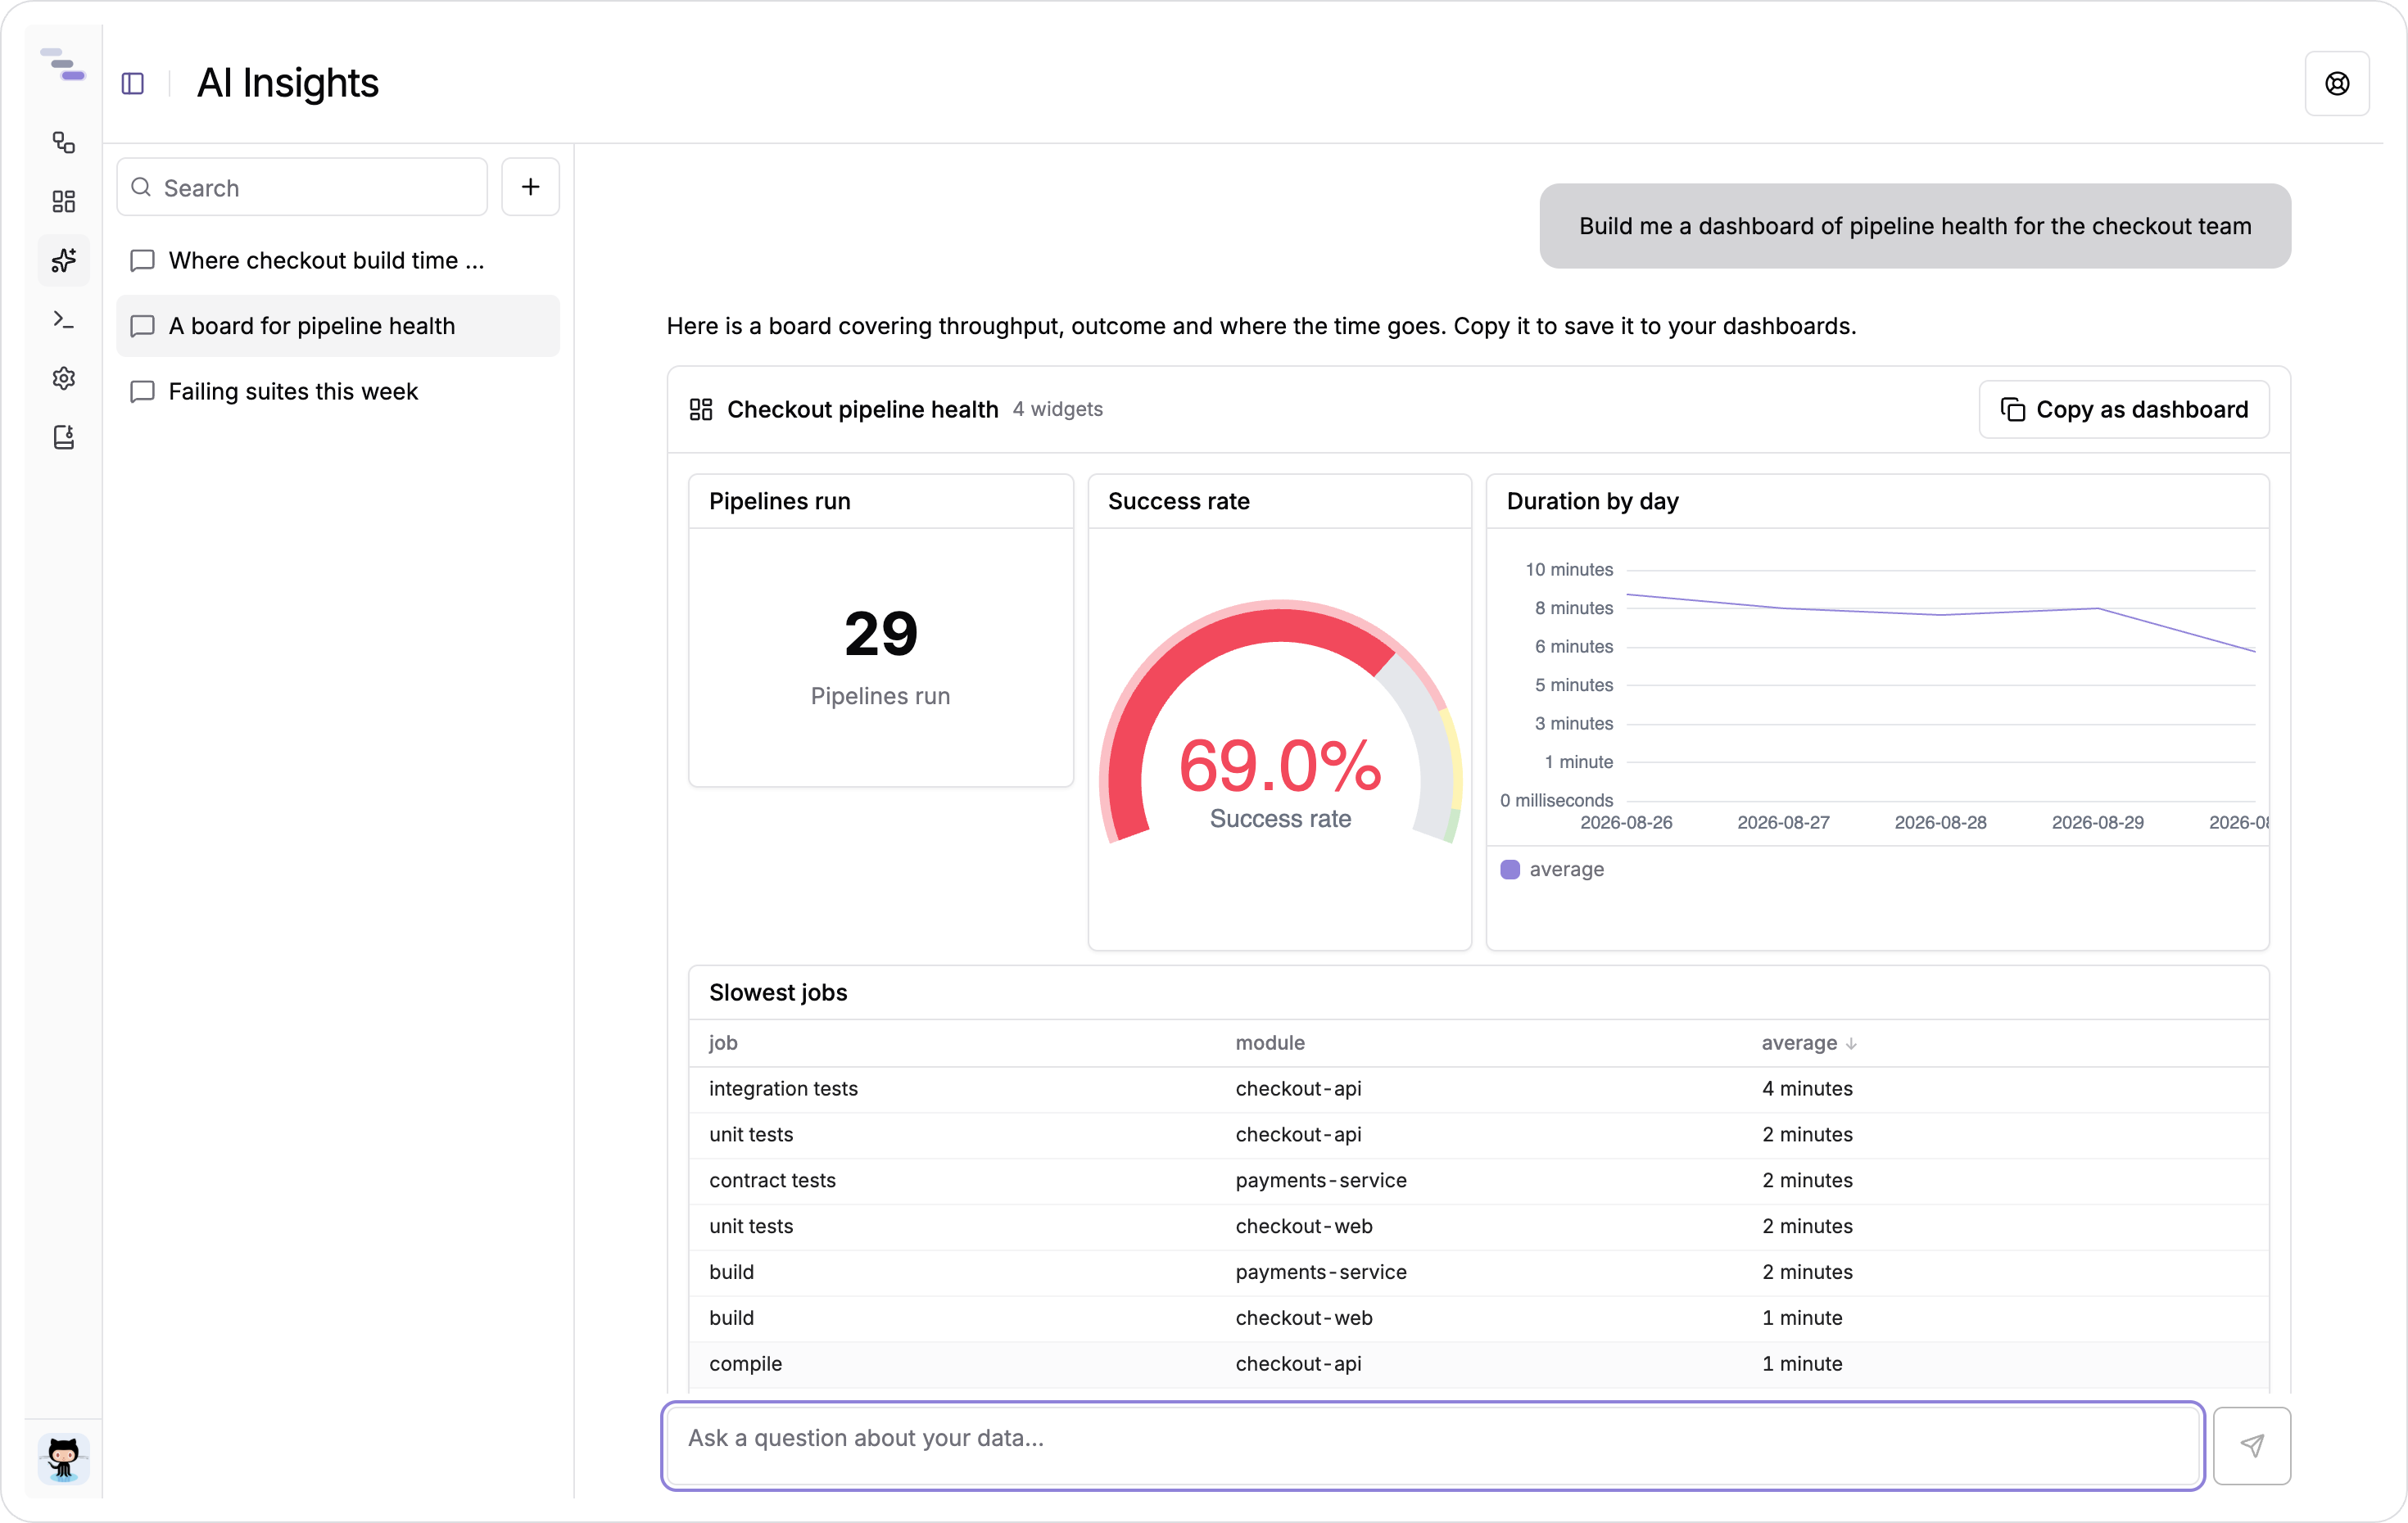
Copy as dashboard persists that board to your team's dashboards and takes you there, where you can edit it like any other board. The preview keeps each query's own time bounds because it runs live in the chat; copying strips them, so the saved board answers to its own time-range filter instead.
Files collected during builds render inline. Ask for a report, a log, or a screenshot and the assistant finds it in your data and previews it with the same viewer the build pages use.
Build breakdowns render the pipeline waterfall for one build, drawing its pipelines, jobs, and steps against the build's own duration with statuses and timings. Ask where a build's time went and you get the timeline rather than a table of rows, with a link through to the build page.
If the assistant cannot find something it will say so rather than inventing coordinates; a question about a build that reported no pipeline stages returns an explicit note to that effect.
Conversations
Conversations are saved per user. The sidebar lists yours, newest first, with a search box, and New insight starts a fresh one. Each conversation has its own URL, so you can bookmark an investigation or send it to a colleague on your team.
Rename a conversation from its menu when the auto-generated title stops describing what the thread became, and delete the ones you no longer need. History is replayed in full when you reopen a conversation, so text, widgets, dashboards, files, and breakdowns all come back.
Follow-up questions carry the thread's history, which is what makes "same query but group by suite" work. Start a new conversation when you change subject, so an unrelated question does not inherit the wrong context.
Seeing what the assistant did
Every reply carries a footer with how long it took and how many steps it needed, and the step count opens a popover that replays the assistant's thought process: what it looked up, each query it validated and ran, what it chose to render, and the tokens and wall-clock time each step consumed. While a run is in flight the same steps stream live.
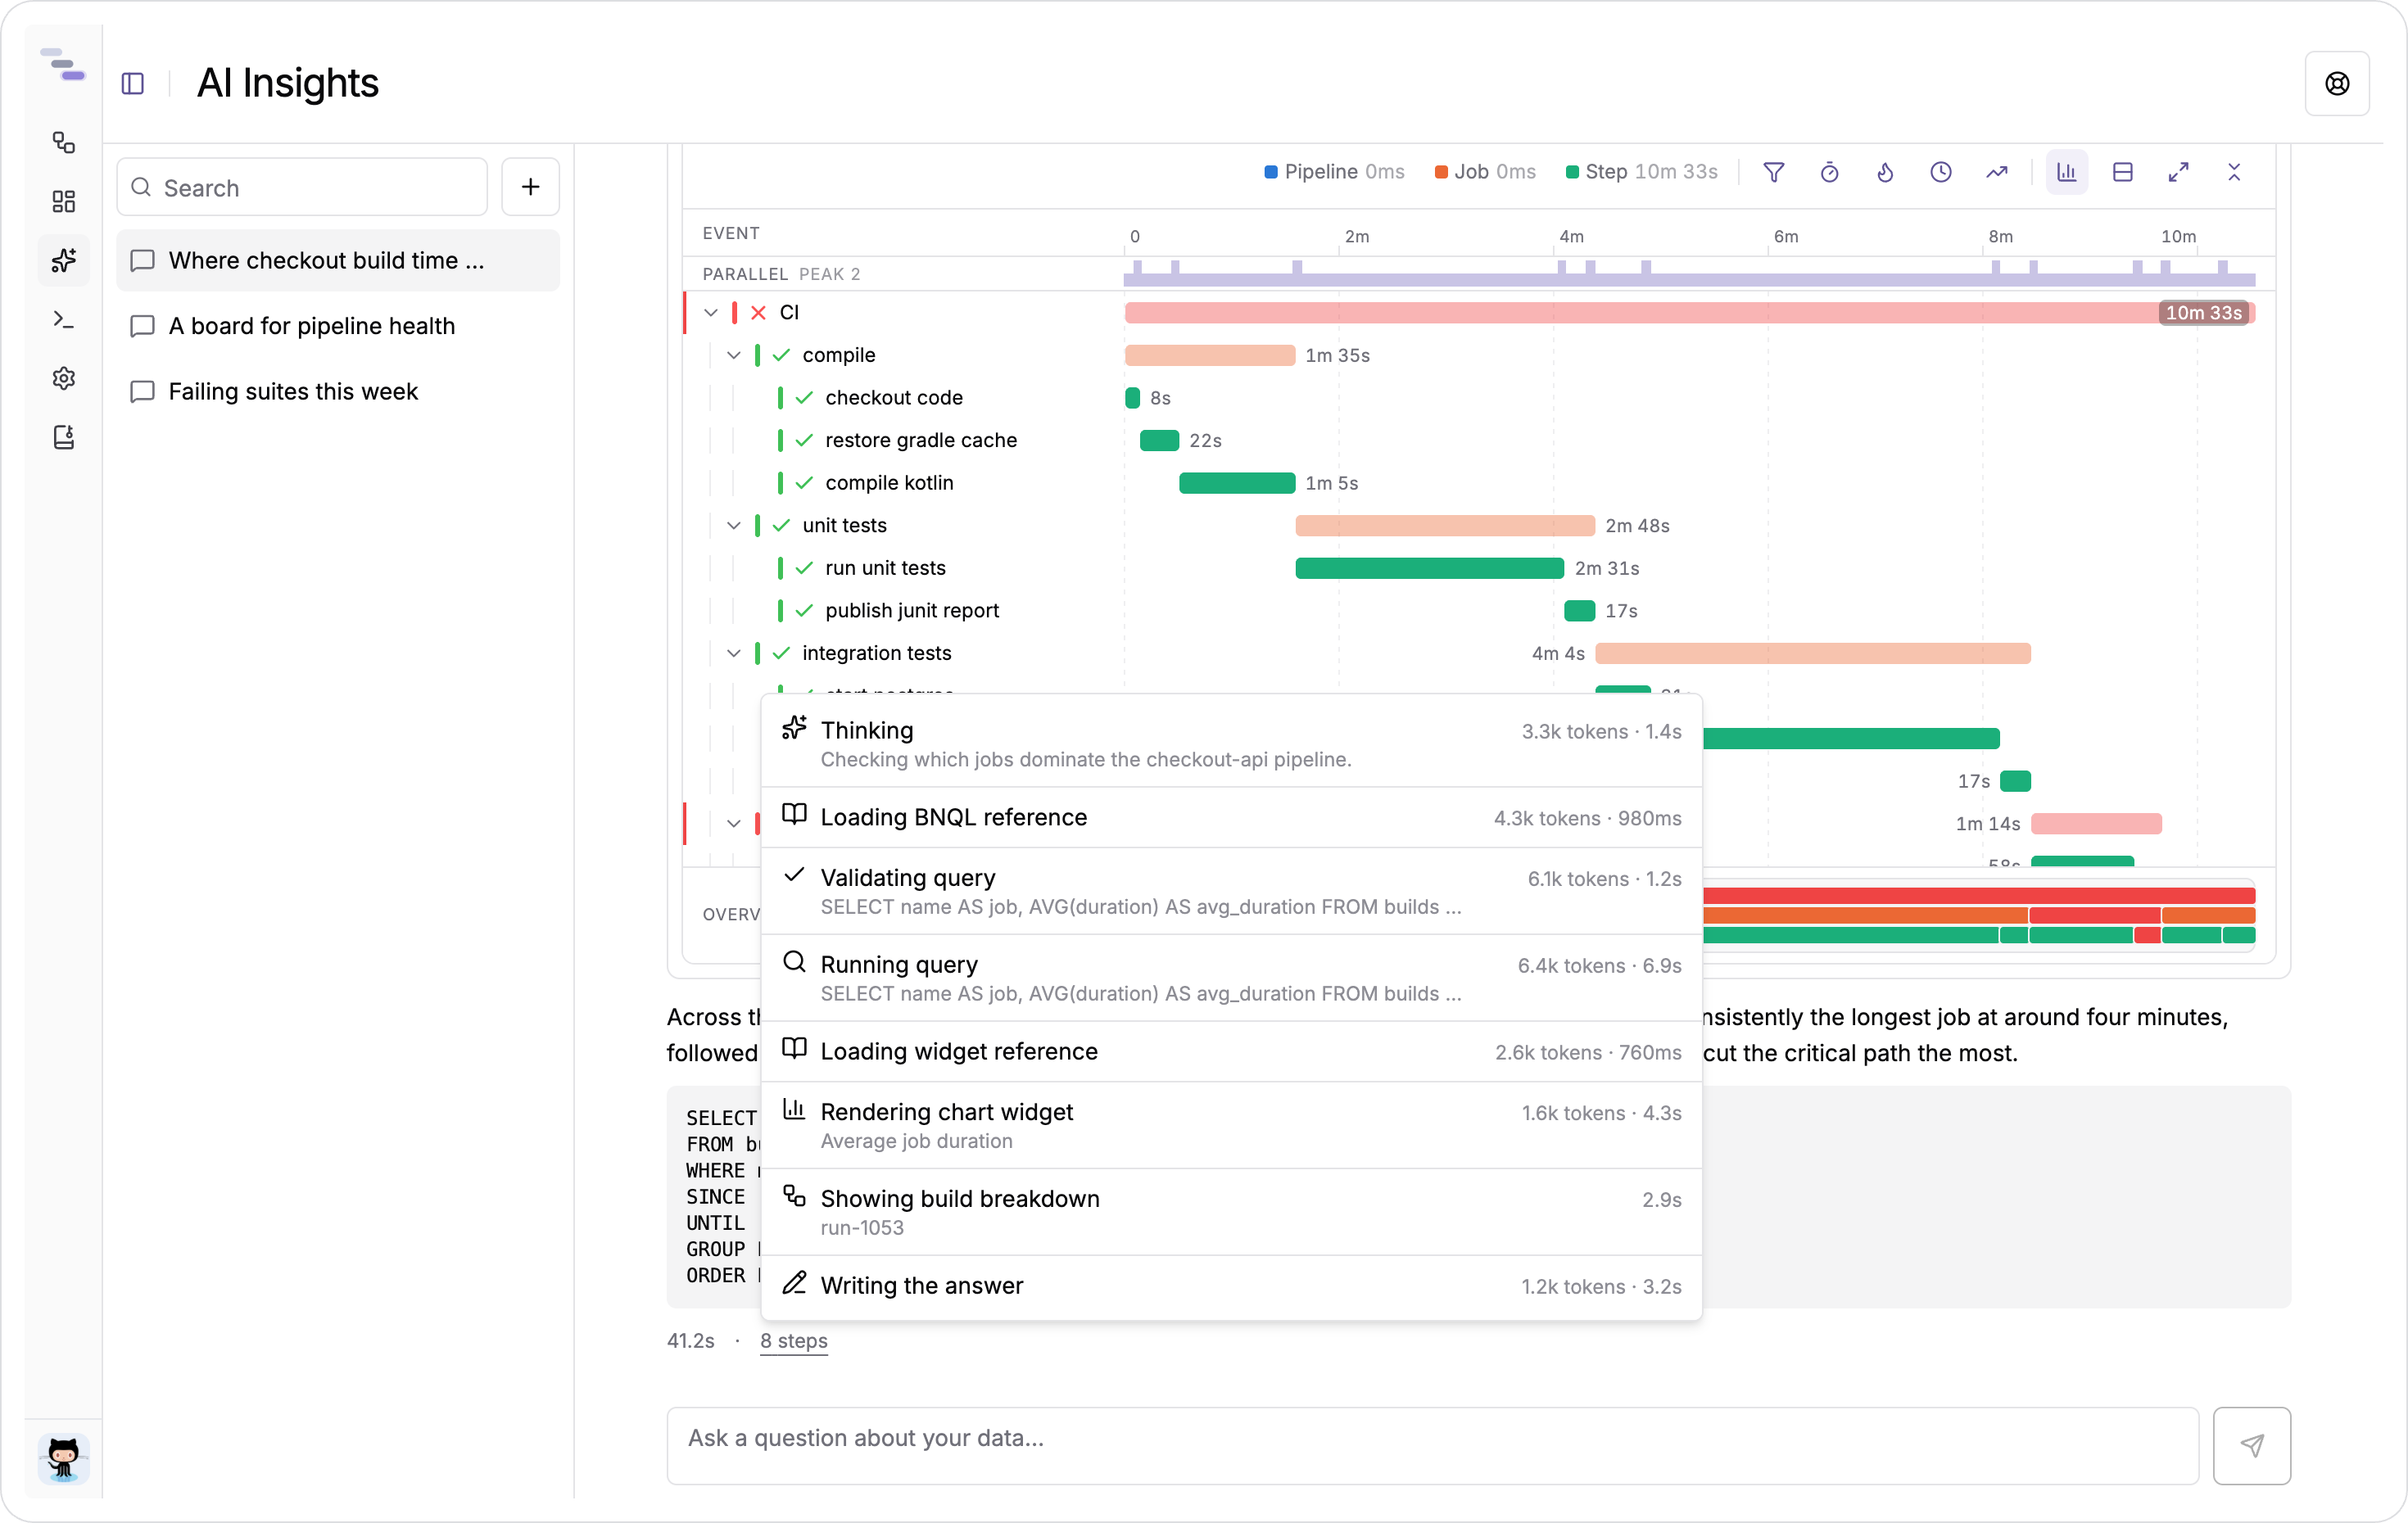
Use it when an answer looks wrong. The query the assistant ran is right there, and a reply closes with the key query in a code block. Hovering that block offers two buttons. One copies the query, ready to paste into the Query editor or a dashboard widget. The other downloads its full result set as CSV.
The foot of that popover totals the reply: tokens in and out, how many of the input tokens were served from the provider's cache, the number of model round-trips, and the wall-clock time of the whole loop.
Getting better answers
Be specific about the window, the branch, and the unit you want. "Failure rate by module on main over the past 30 days" gives the assistant everything it needs; "how are we doing?" does not.
Ask for one thing at a time. A focused question produces one well-chosen chart, while a broad one produces several mediocre ones. If a reply is close but not right, say what to change, such as "same query but group by suite", rather than restating the whole question. The conversation carries its own history.
Treat a dashboard request as its own question. Asking to build a dashboard produces a laid-out board you can save, which is a better starting point than copying widgets across one at a time.