

Exploring Builds
The Builds section is the event explorer. It drills from a whole team down to a single test case, and every level answers the same two questions: what is failing, and what is slow.
How your data is organised
Collected events are grouped into a hierarchy. An organisation maps to your version control organisation or group. A project maps to a repository. A module is a unit of work inside that repository, such as a Gradle subproject, a service, or a package, and is where builds accumulate. A build is one run of your pipeline. Events are the individual things that happened in that run: pipelines, jobs, steps, test suites, test classes, test cases, commands, files, and properties.
You do not create this structure by hand. It appears as the CLI and your version control integration submit events, and the identifiers come from the source: your repository name becomes the project, your workflow's run number becomes the build.
Team overview
The Builds page lists the organisations that reported events in the selected time range. If nothing has arrived yet, the page shows a prompt to configure an integration instead. Follow Getting Started to connect one.
From an organisation you reach its projects. A project page opens on a graph of its recent runs and offers two tabs underneath.
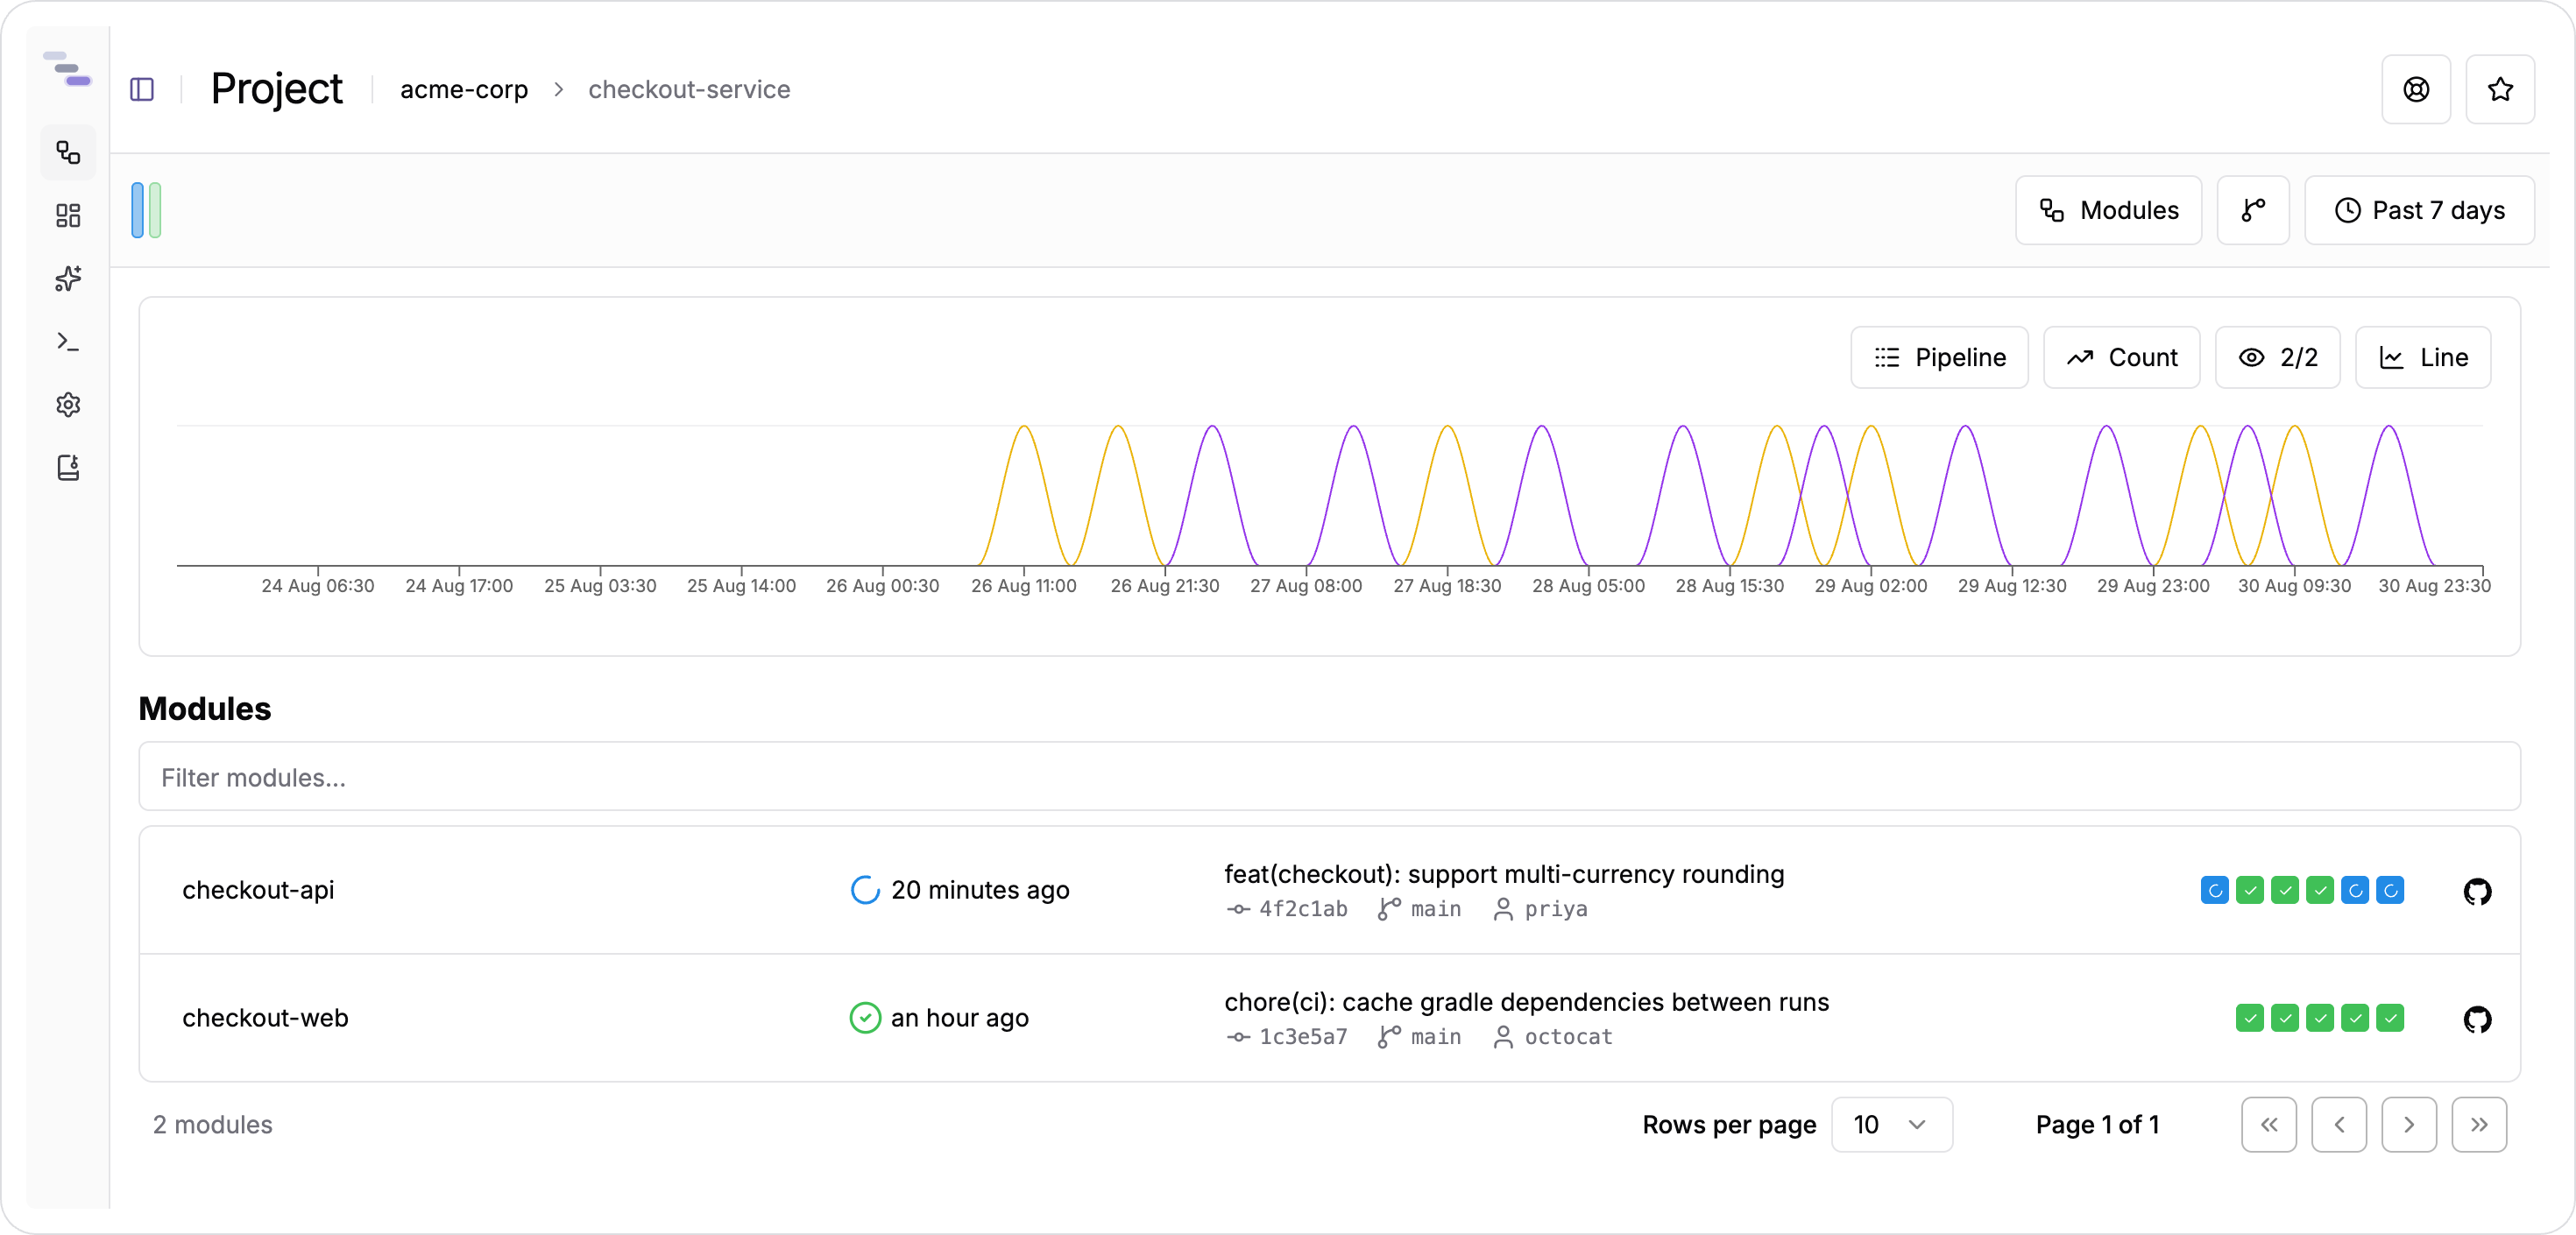
Modules lists the modules that built in the range, each with the commit that triggered its latest run, who pushed it, and a strip of status squares for the recent history. Commits lists the commits themselves, so you can start from a change rather than from a pipeline.
Opening a commit shows its message, author, and the files it added, removed, and modified, followed by the pipeline timelines of every build it triggered. That view is the fastest way to answer "did my change break the build?"
Module page
A module page opens with a stability graph. It shows a run-by-run band of successes and failures over the selected range, switchable between dimensions such as pipelines, jobs, steps, and tests, and between a count and a rate. Underneath sits the table of builds, newest first.
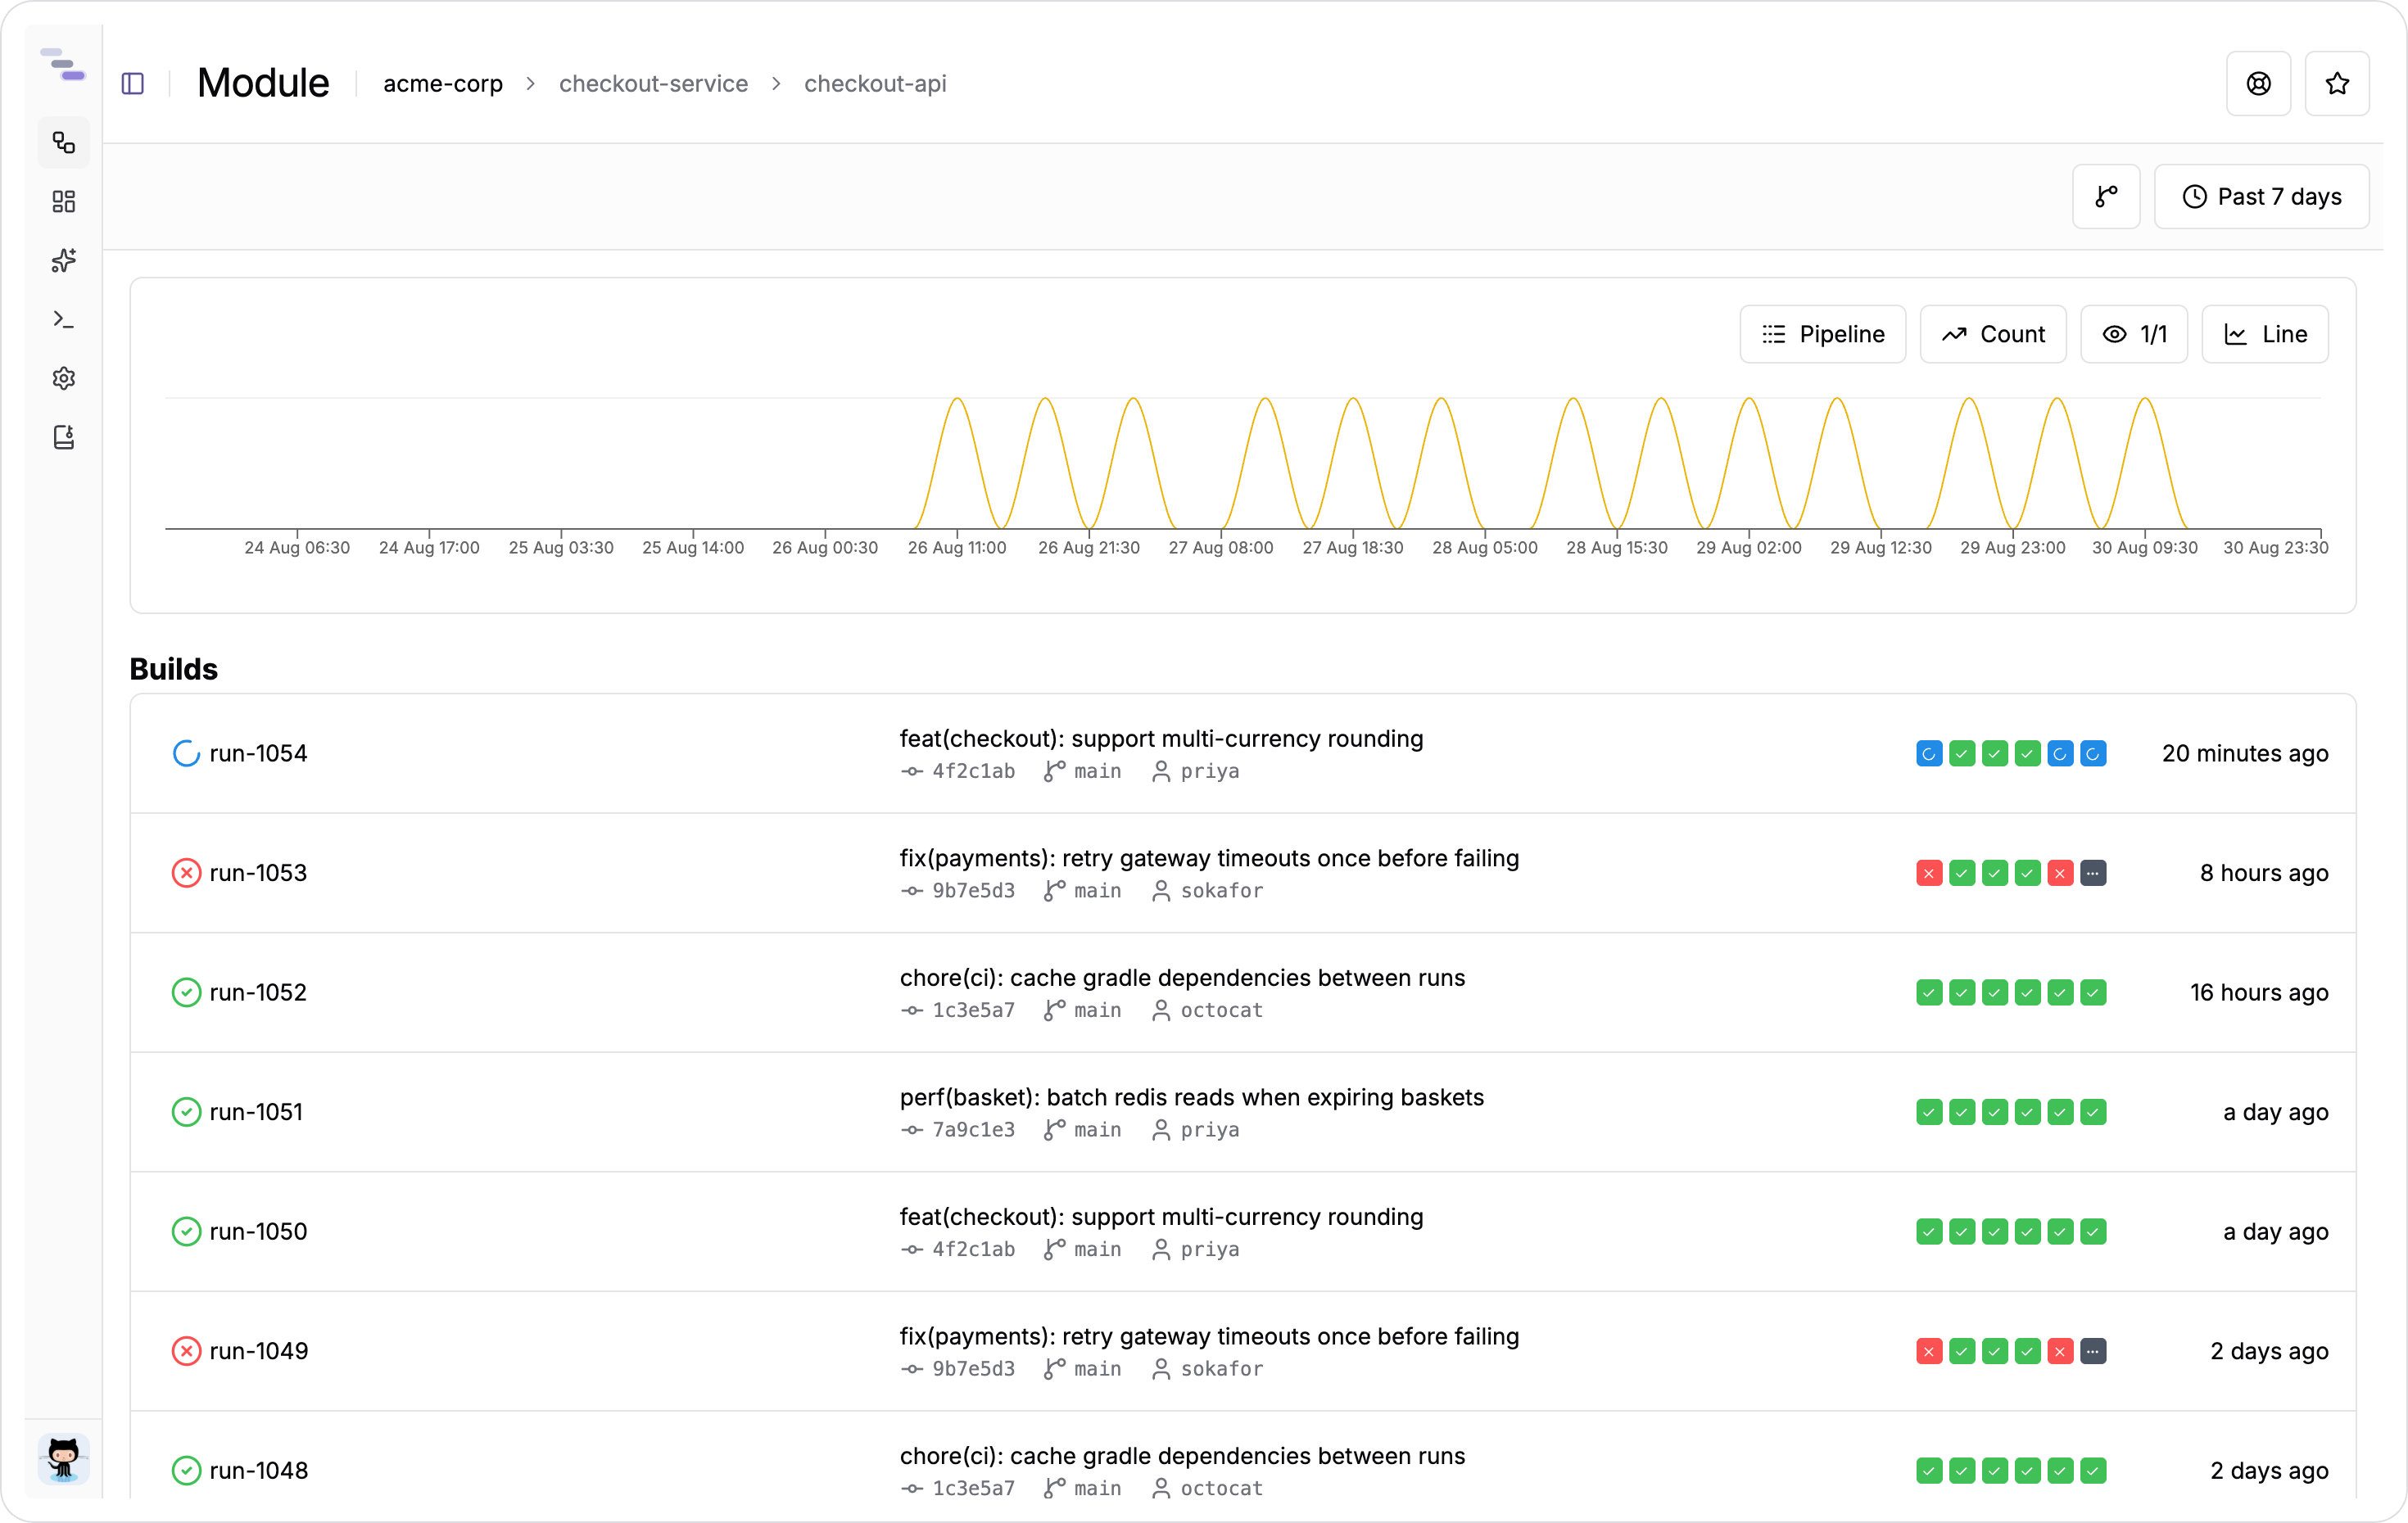
Each row carries the build identifier, its status, the commit subject with its short SHA, branch and author, a strip of squares summarising the pipelines inside it, and when it ran. A spinning marker means the build is still going. The squares are the quickest read on the page: a row of green with one red square tells you which stage to open before you open anything.
A branch filter next to the time range narrows everything to one ref. Comparing main against a feature branch here is usually enough to tell whether a regression is yours or everyone's. Bookmark the modules you own, from the star in the header, and they appear in the left navigation on every page.
Build overview
A build has three tabs. Overview starts with the commit that triggered the run, then the stability graph for context, then the pipeline breakdown.
The breakdown is a waterfall of pipelines, jobs, and steps drawn against the build's own duration. Each bar is positioned by when its stage started and sized by how long it took, coloured by nesting depth, and marked with a status icon. Expand a row to see what ran inside it.
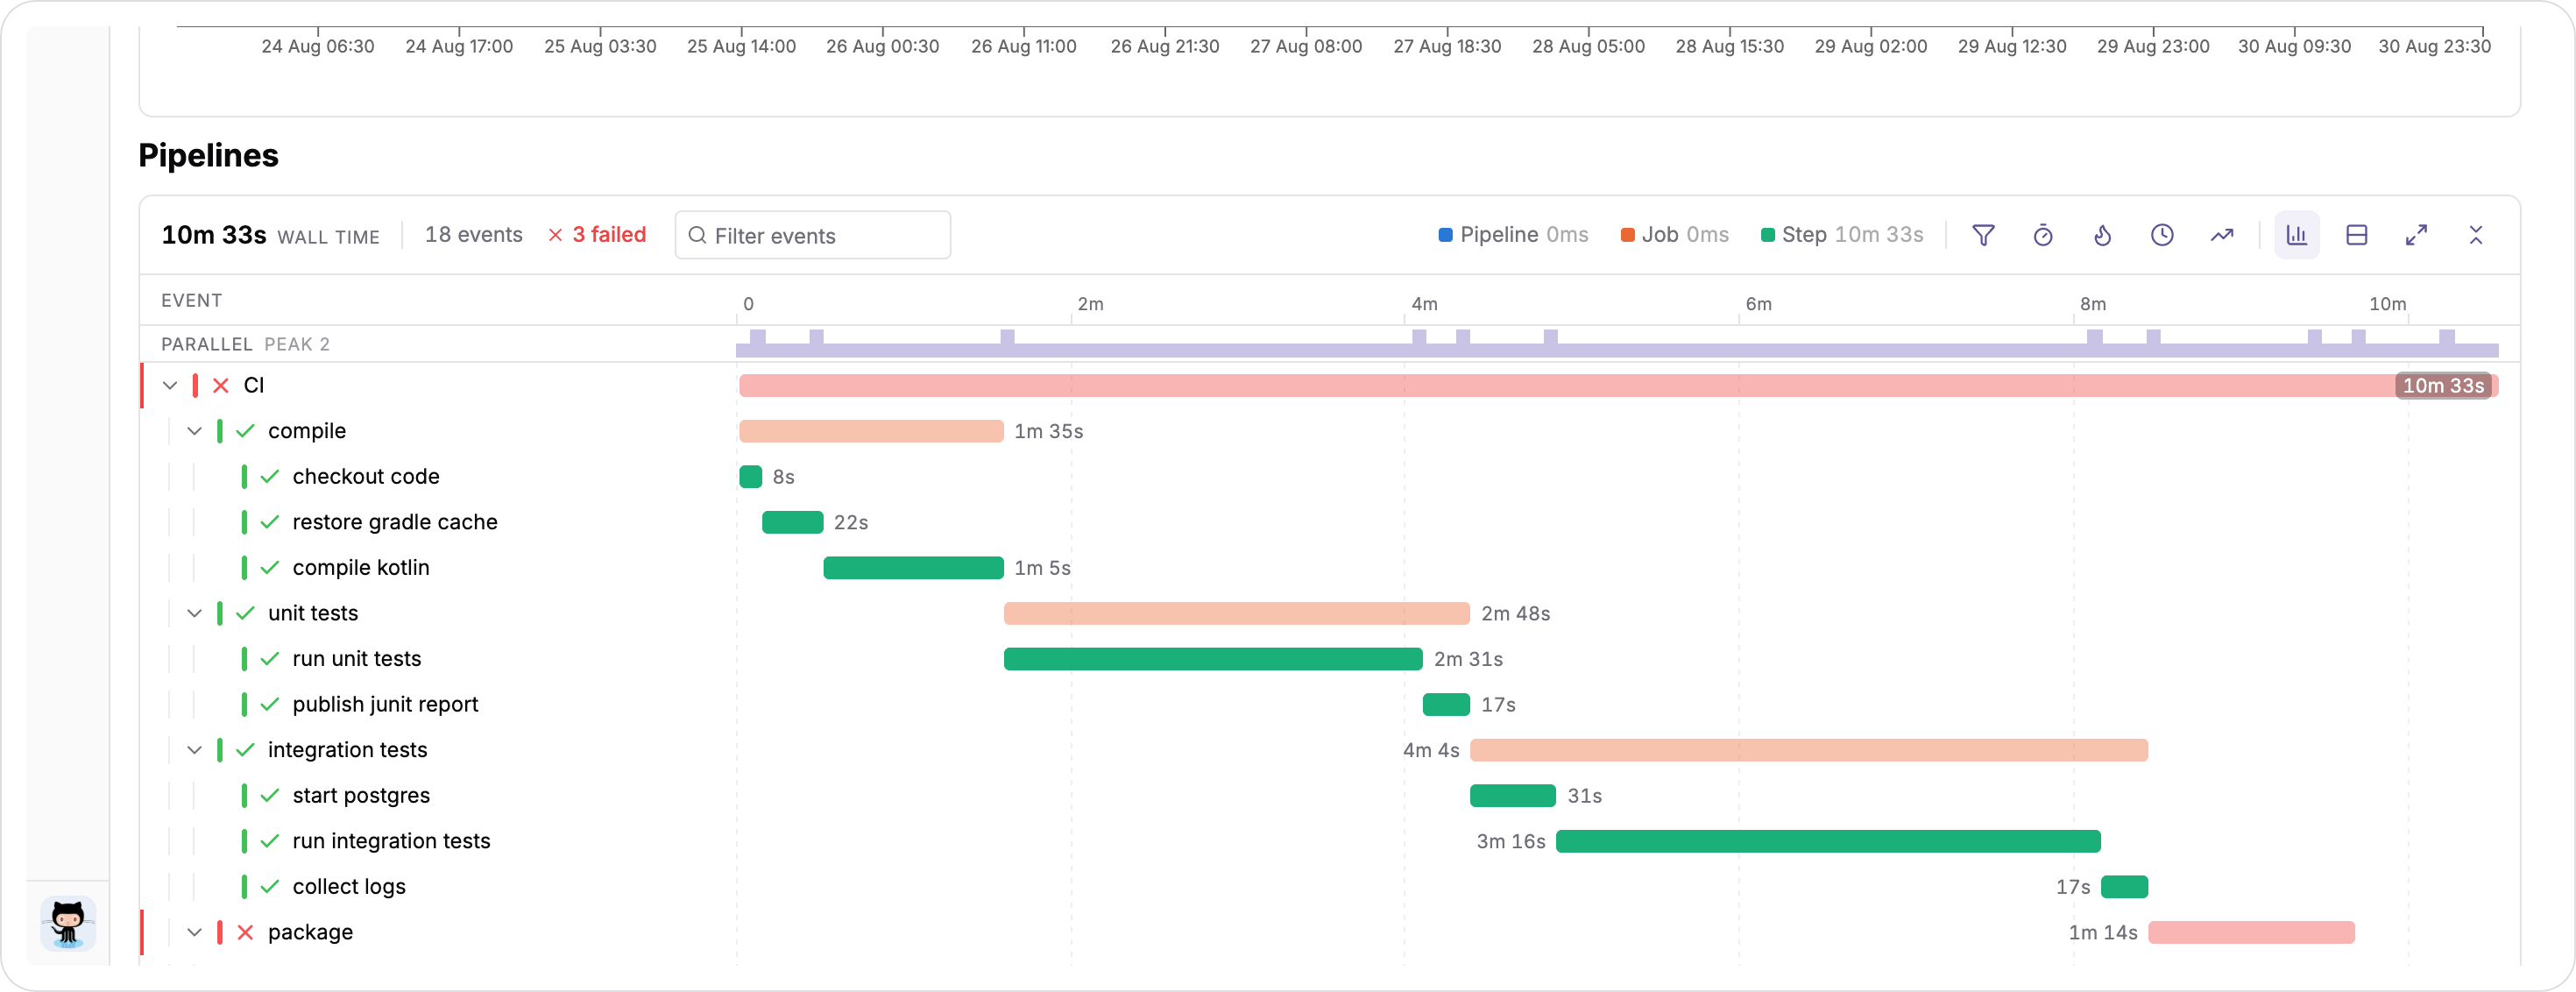
Read it left to right for the critical path. Bars that start together ran in parallel, and a gap before a bar means the stage was waiting rather than working. Hovering any bar shows the full event detail, and clicking through opens that stage's own event page.
Below the waterfall, the events table lists everything the build recorded, with the duration of each event next to the same value as a share of the build. Filter by name, by status (running, successful, failed, skipped, cancelled, unknown), and by category: file, test suite, test class, test case, pipeline, job, step, command, or property. The filters are held in the URL, so a filtered view is a link you can paste to a colleague.
Tests
The Tests tab focuses on the test results collected for the build. It opens with a breakdown by status across test cases, classes, and suites, then lists the results themselves.
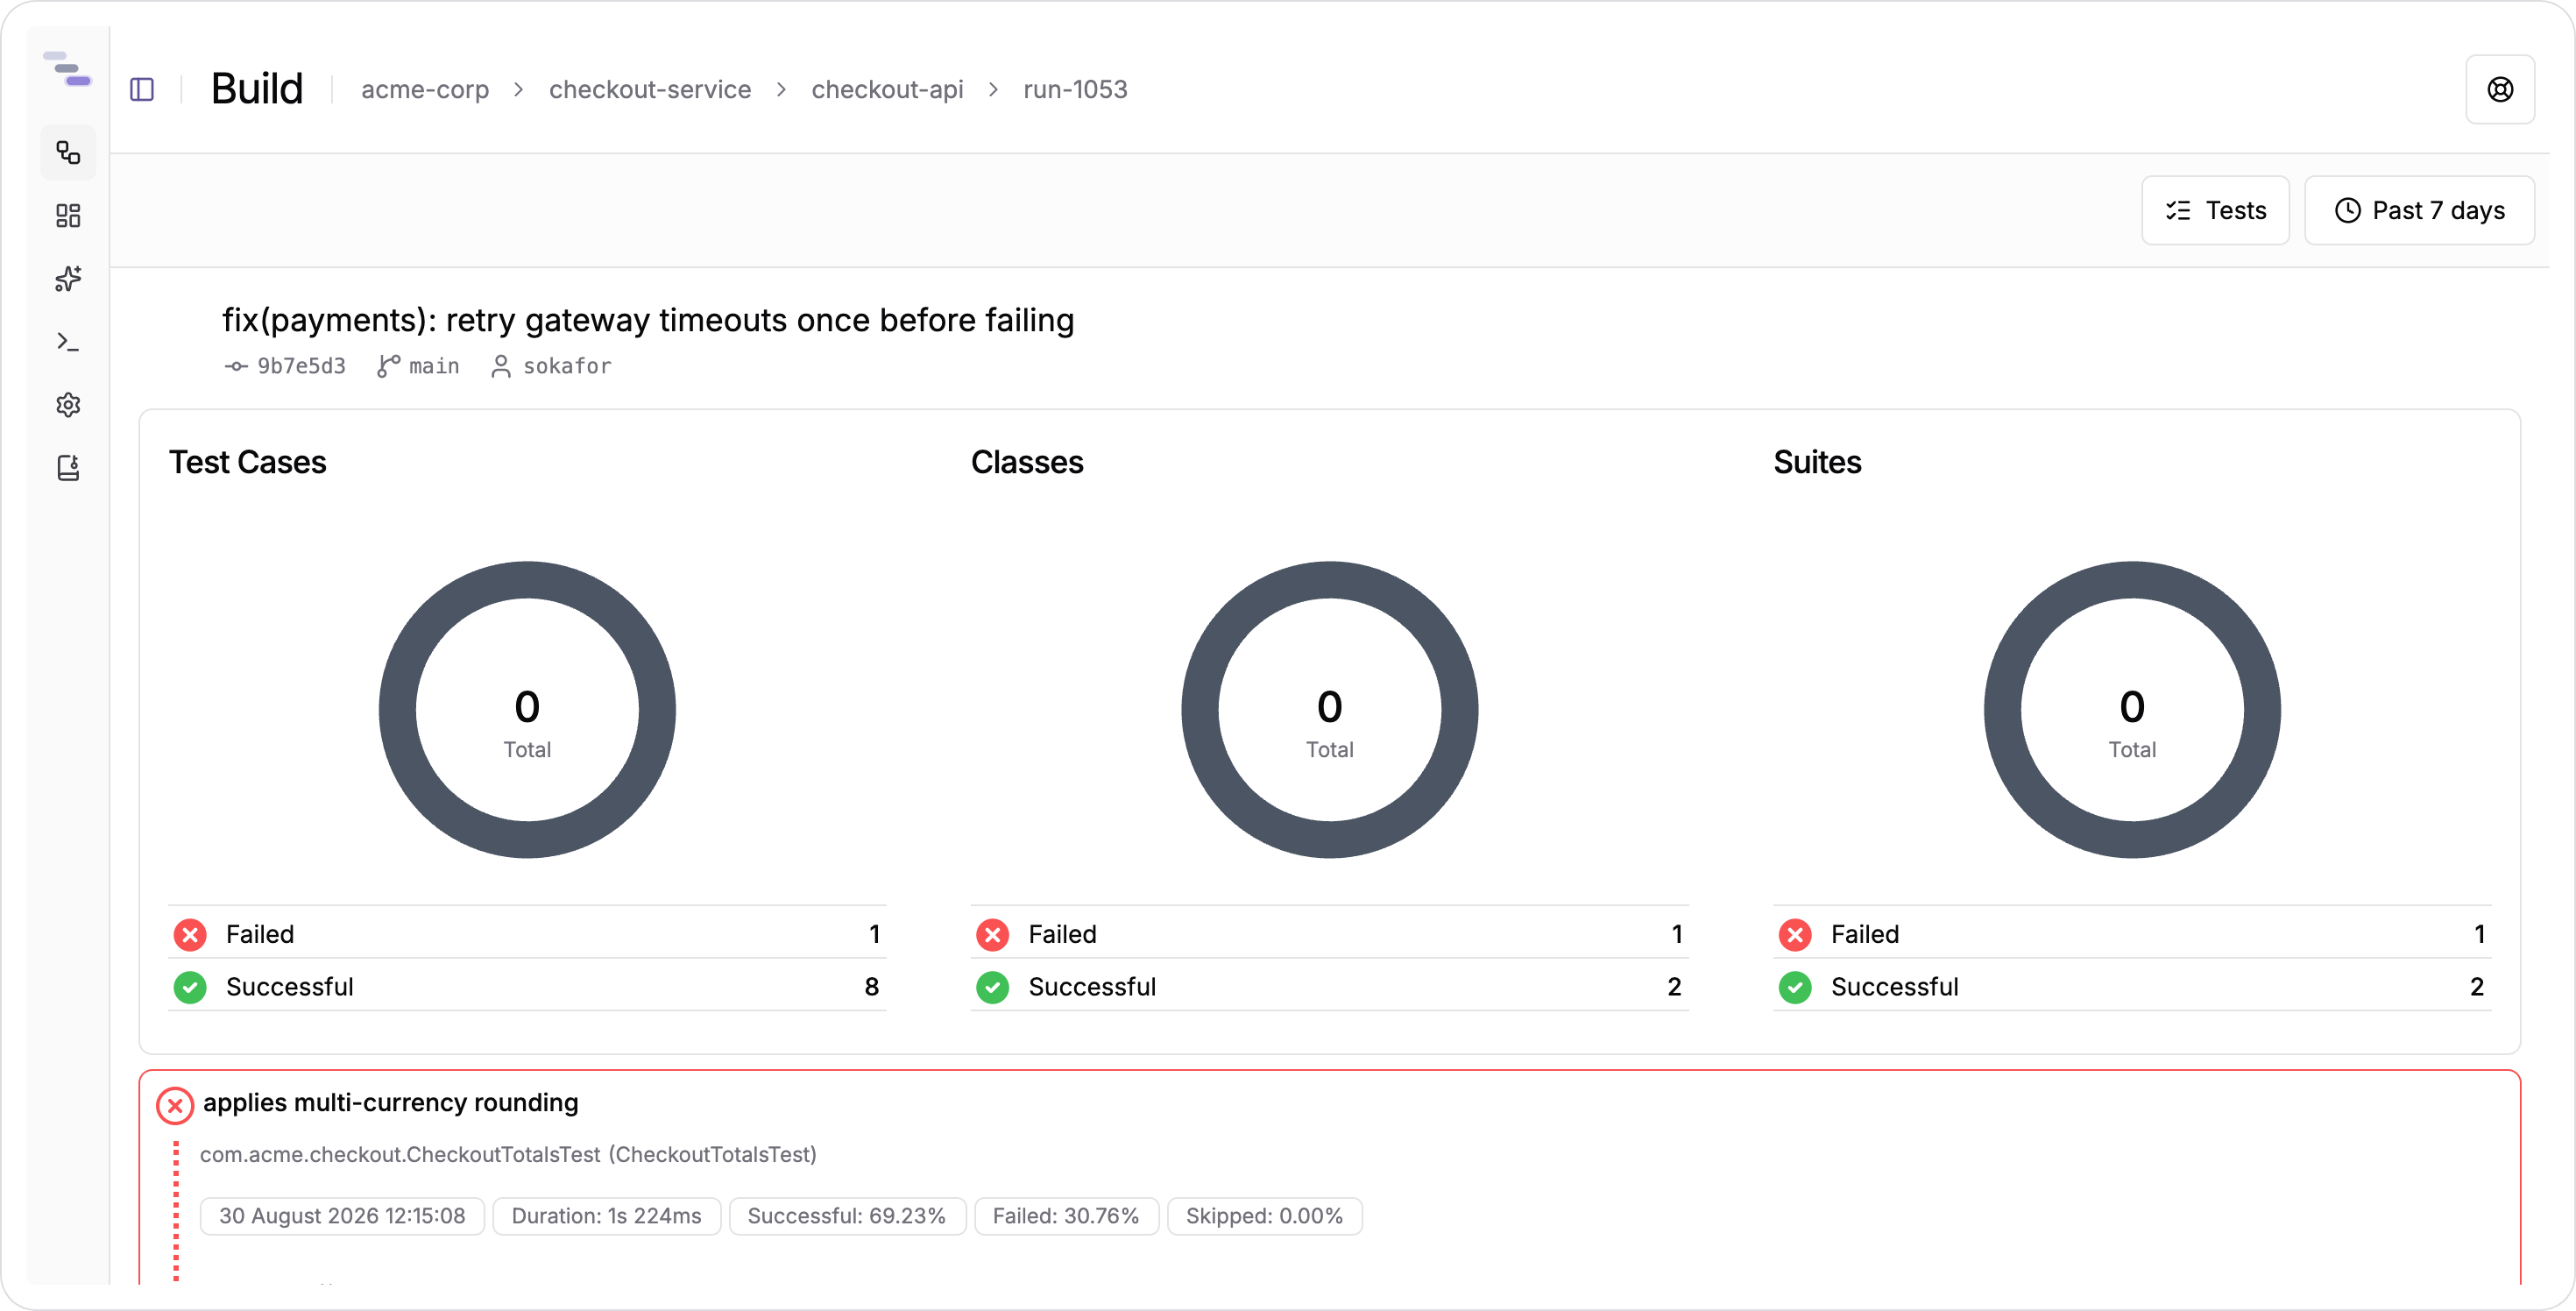
The donuts answer "how bad is it" at a glance. The list underneath answers "what exactly", with each suite showing its duration and its success, failure, and skip rates, and expanding to the classes and cases inside it. Every row links to the event page for that result.
Files
The Files tab is a browser for everything collected during the run: a tree of files on the left and the selected one previewed on the right.
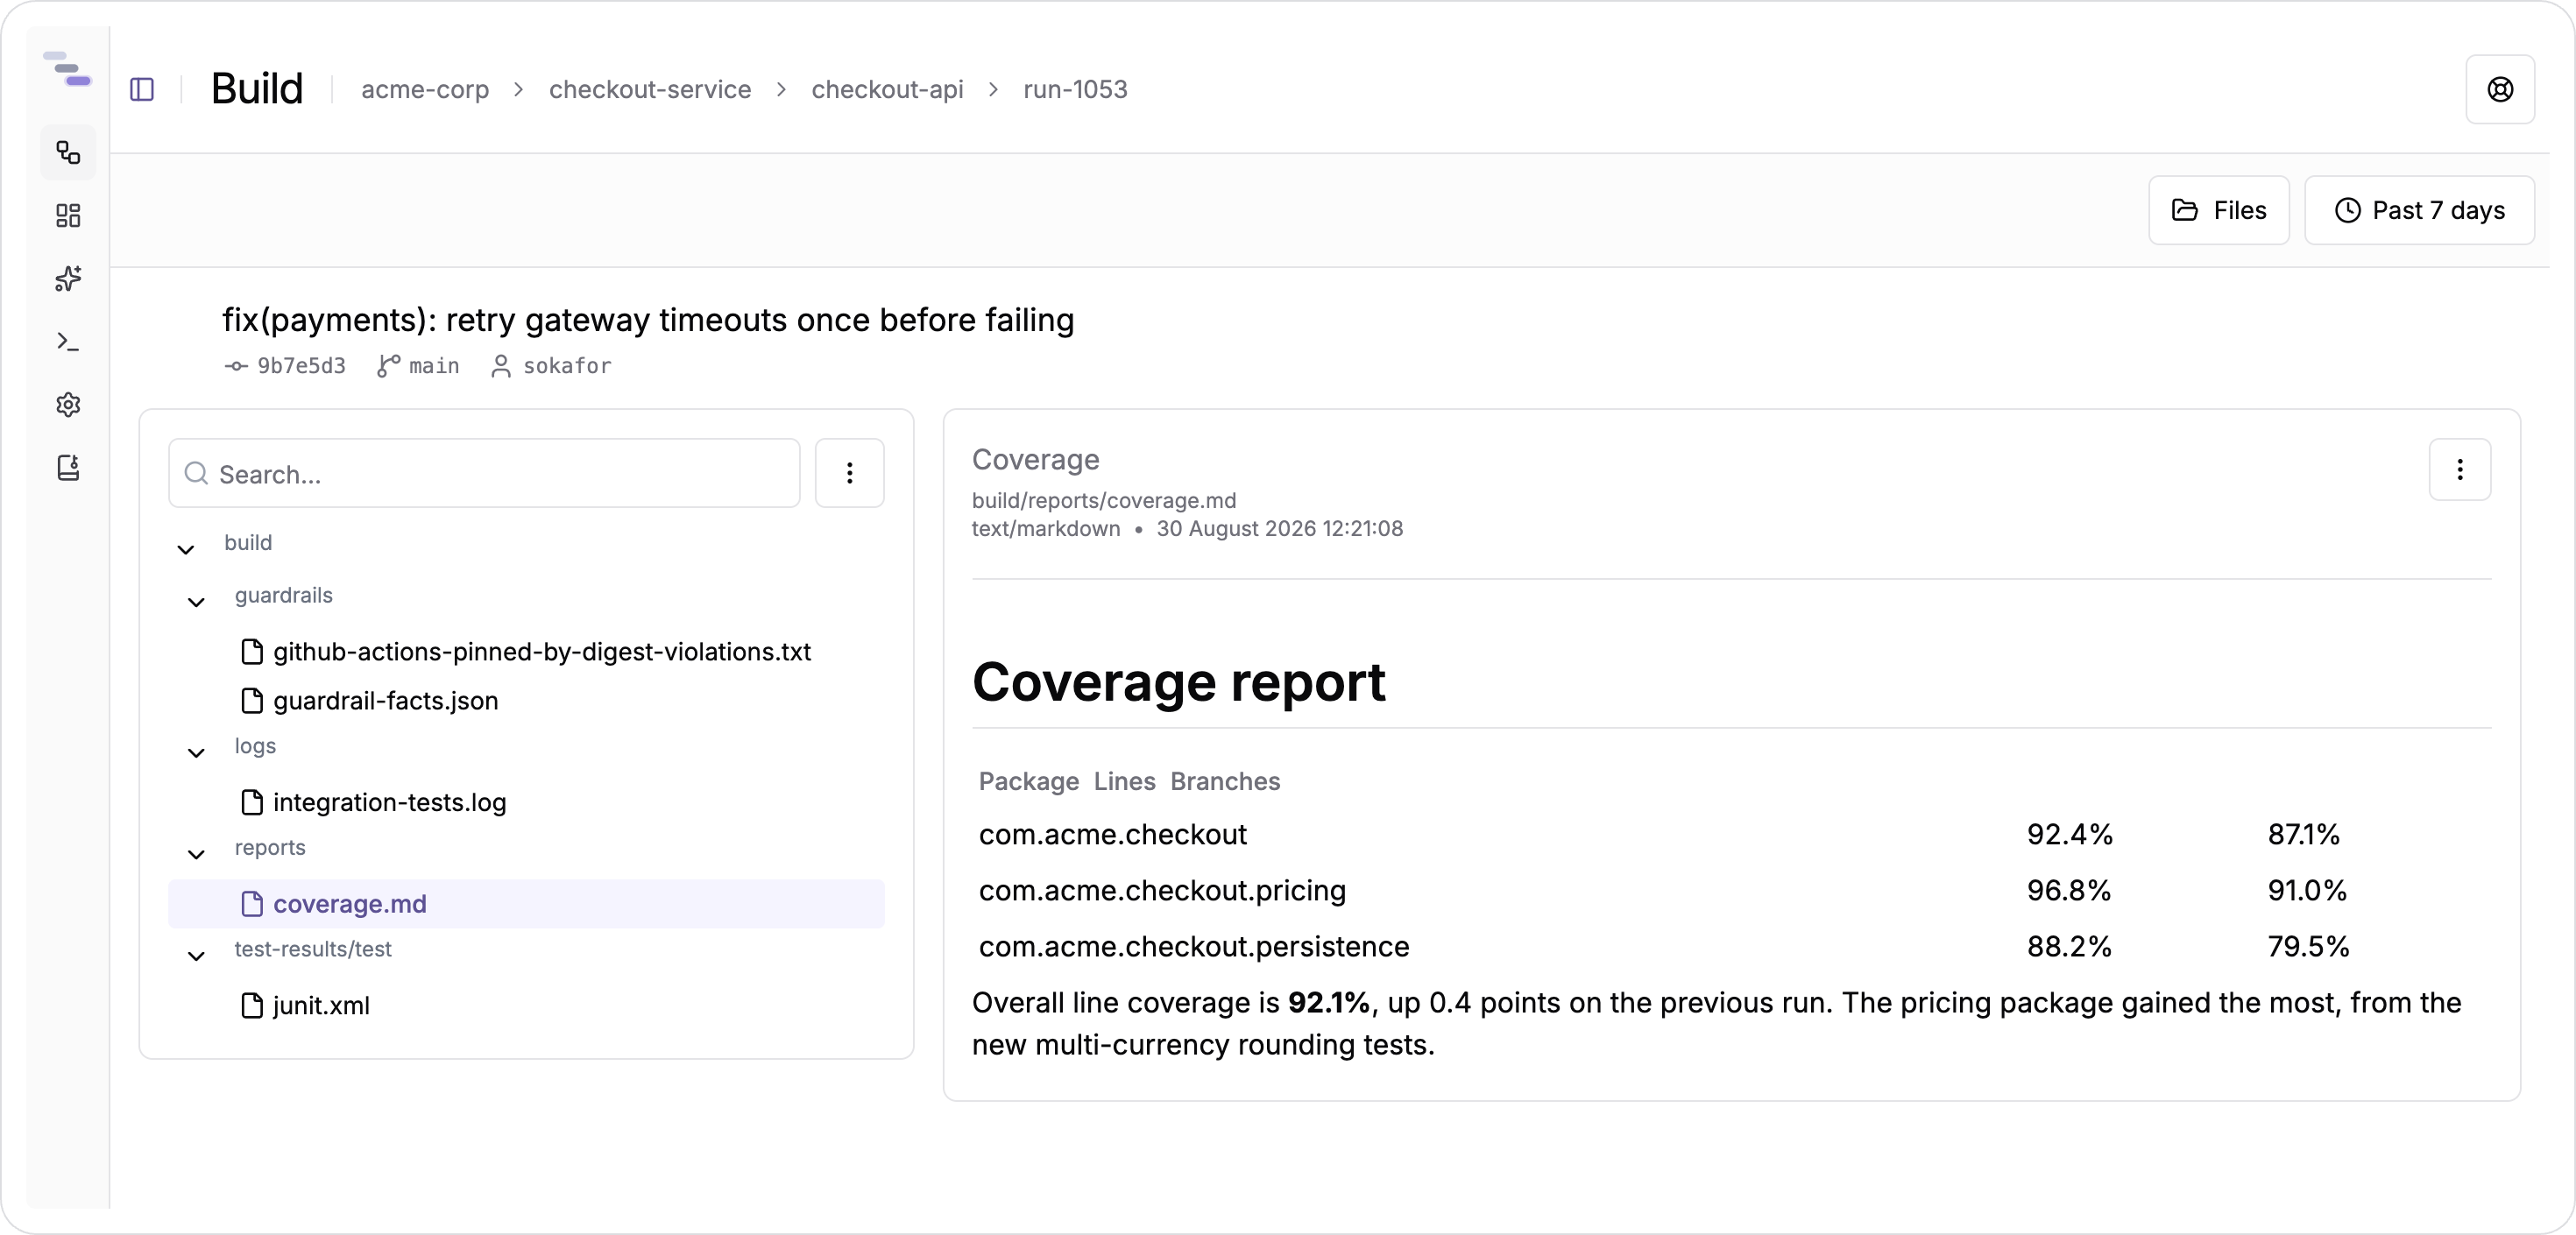
The tree follows the paths the files were collected from, so a report keeps the shape it had on the build agent. The selection is held in the URL, which means a link to a specific report opens on that report rather than on the tab.
Event sheet
You do not have to leave a build to read one of its events. Clicking a row in the events table on the Overview tab, or a suite, class, or case in the Tests tab, slides a panel in from the right carrying the full detail of that event.
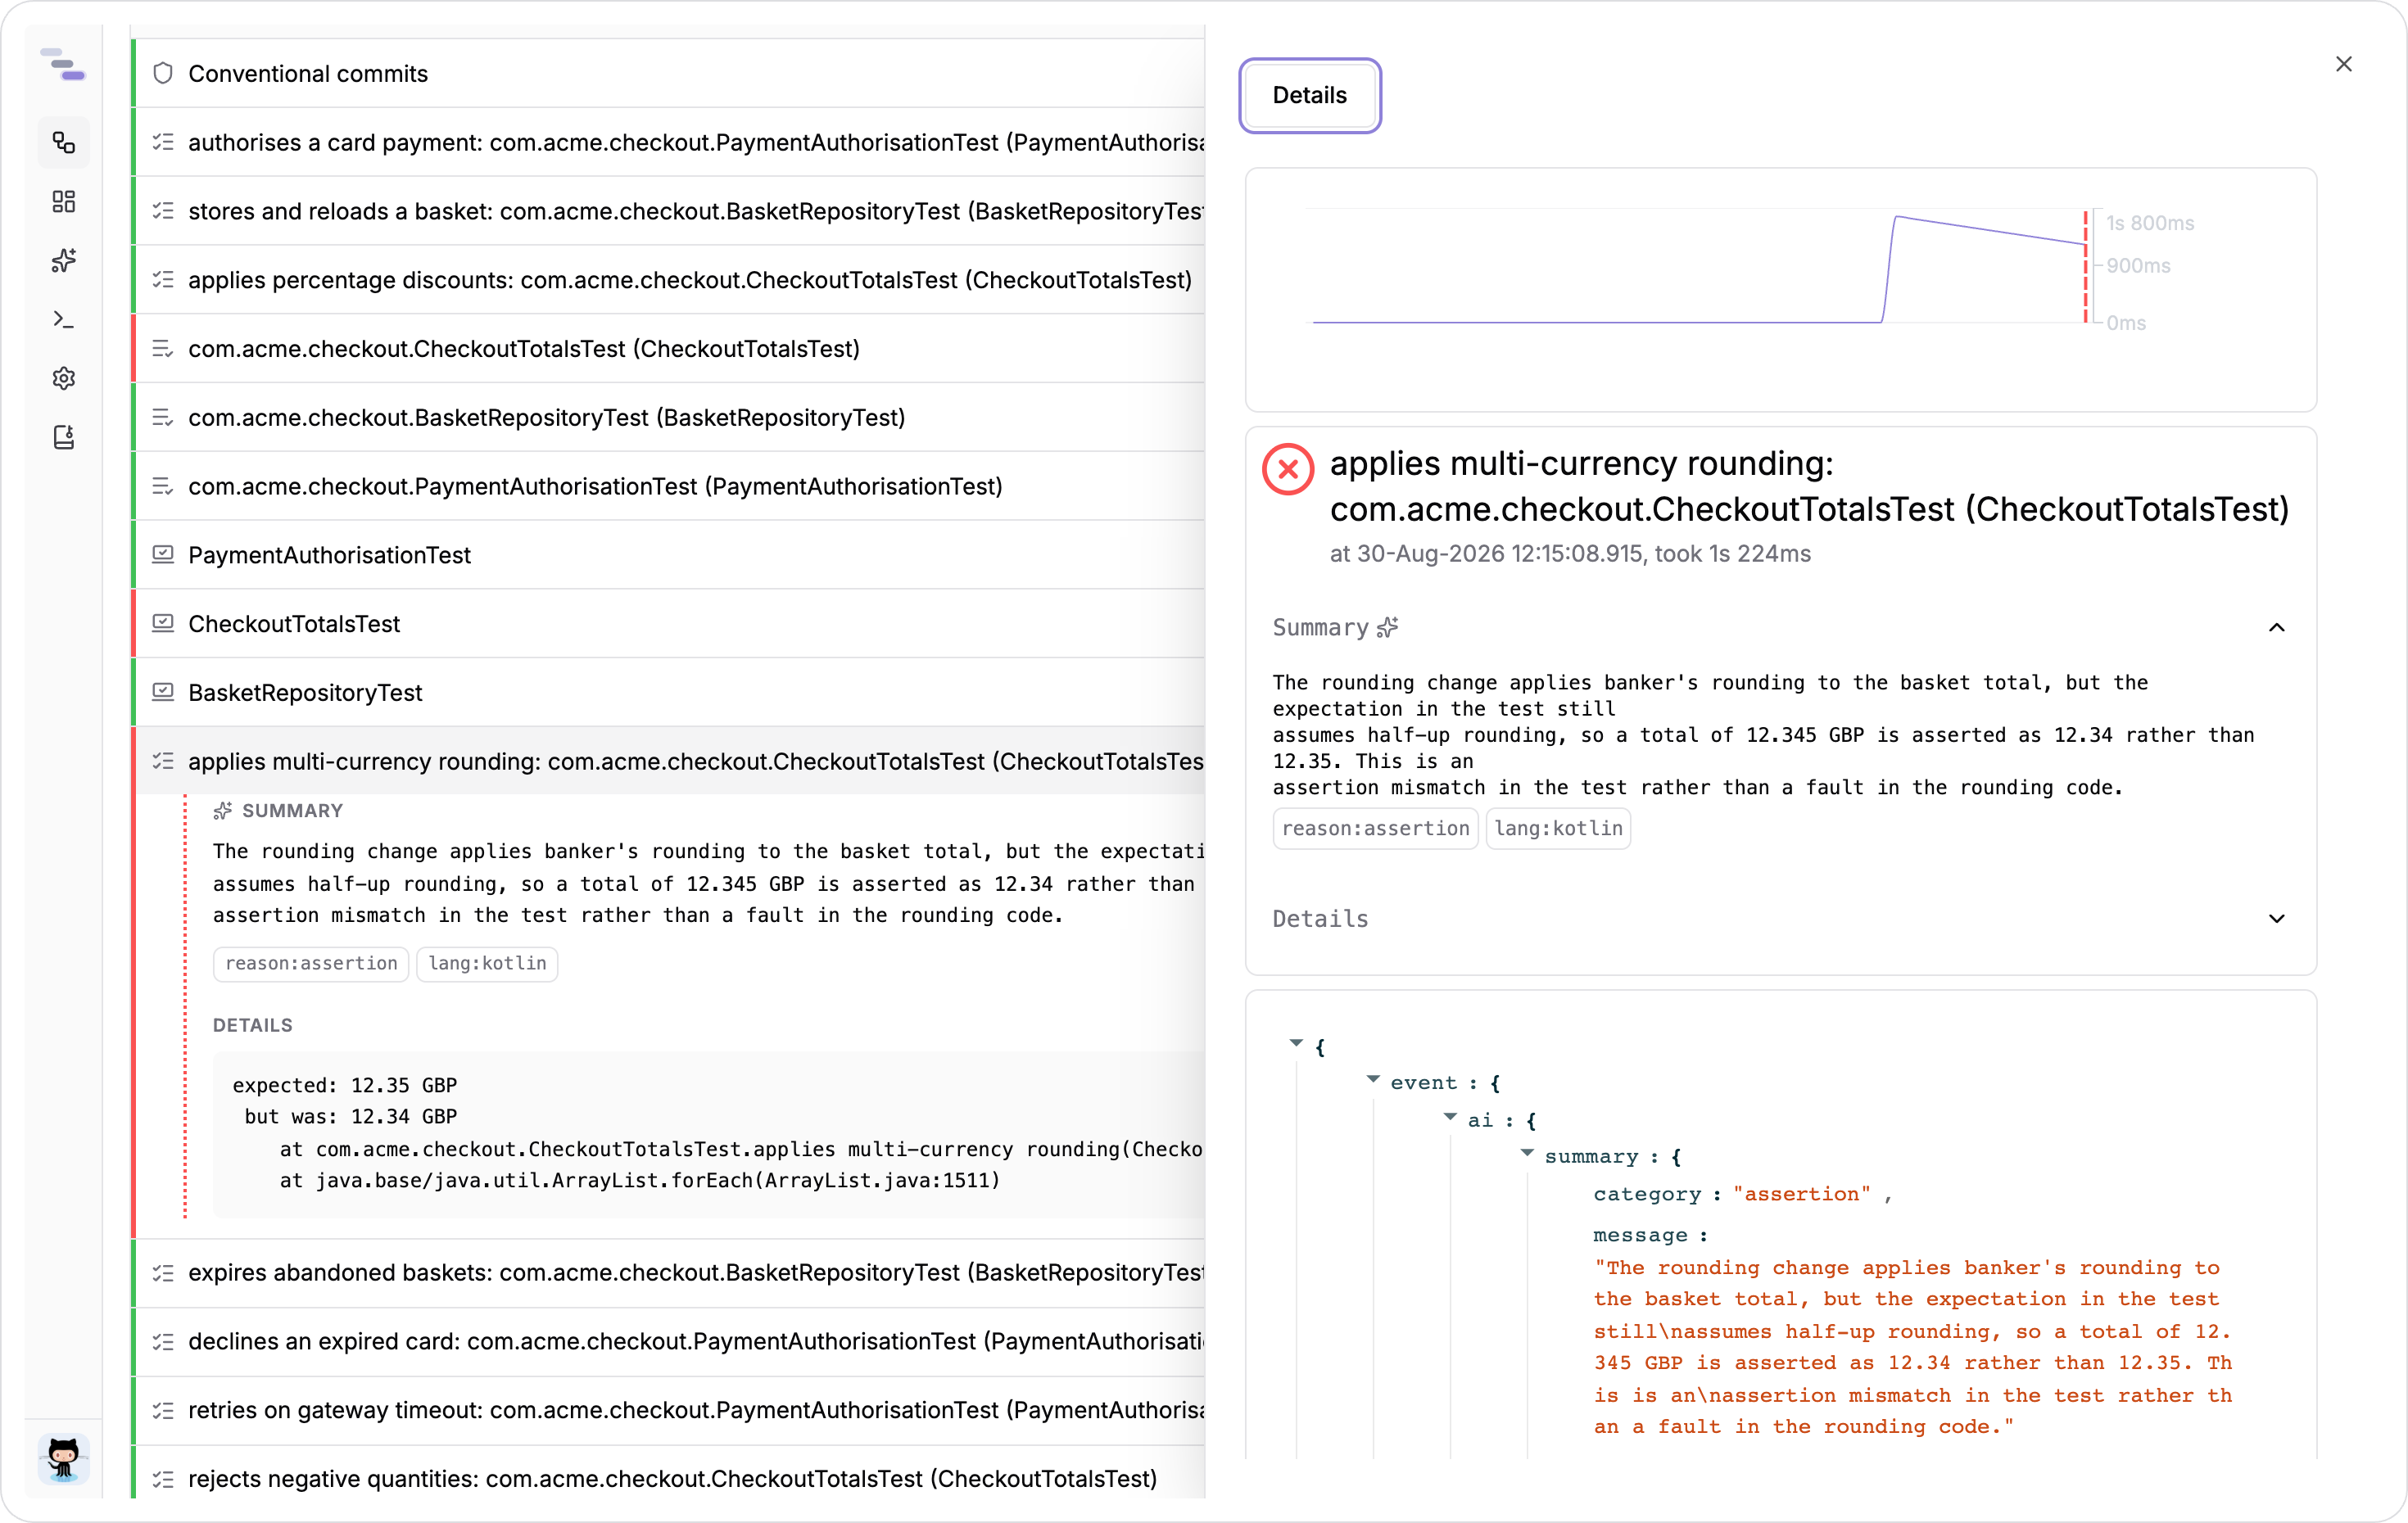
The sheet does not dim or block the page behind it, so the table stays readable while it is open. Click another row and the sheet swaps to that event, since only one event is selected at a time. Press Escape, or click anywhere outside both the table and the sheet, to close it. Where a row carries an external link icon at its end, which is the case for stages that came from your CI provider, that icon takes you to the run itself rather than opening the sheet.
Inside, from the top down: a statistics chart plotting this event across earlier builds, shown only when there is history to plot; a status panel with the name, status, duration, and timestamp, carrying the AI summary and its reason and language badges when the failure has been analysed, and the raw message and stack trace behind the Details toggle in that panel; then every file attached to the event, each previewed in place; and last, the event's raw attributes as an expandable JSON tree for anything the panels above do not show.
Working this way keeps your filters and your place in the table. You open a failure, read the summary and its console output, close the sheet, and open the next one, without ever losing the list you are working through. The Details button above the panels, at the top of the sheet, opens the full event page when you want the whole thing.
Event page
An event page is the end of the drill-down: one test case, one step, one file.
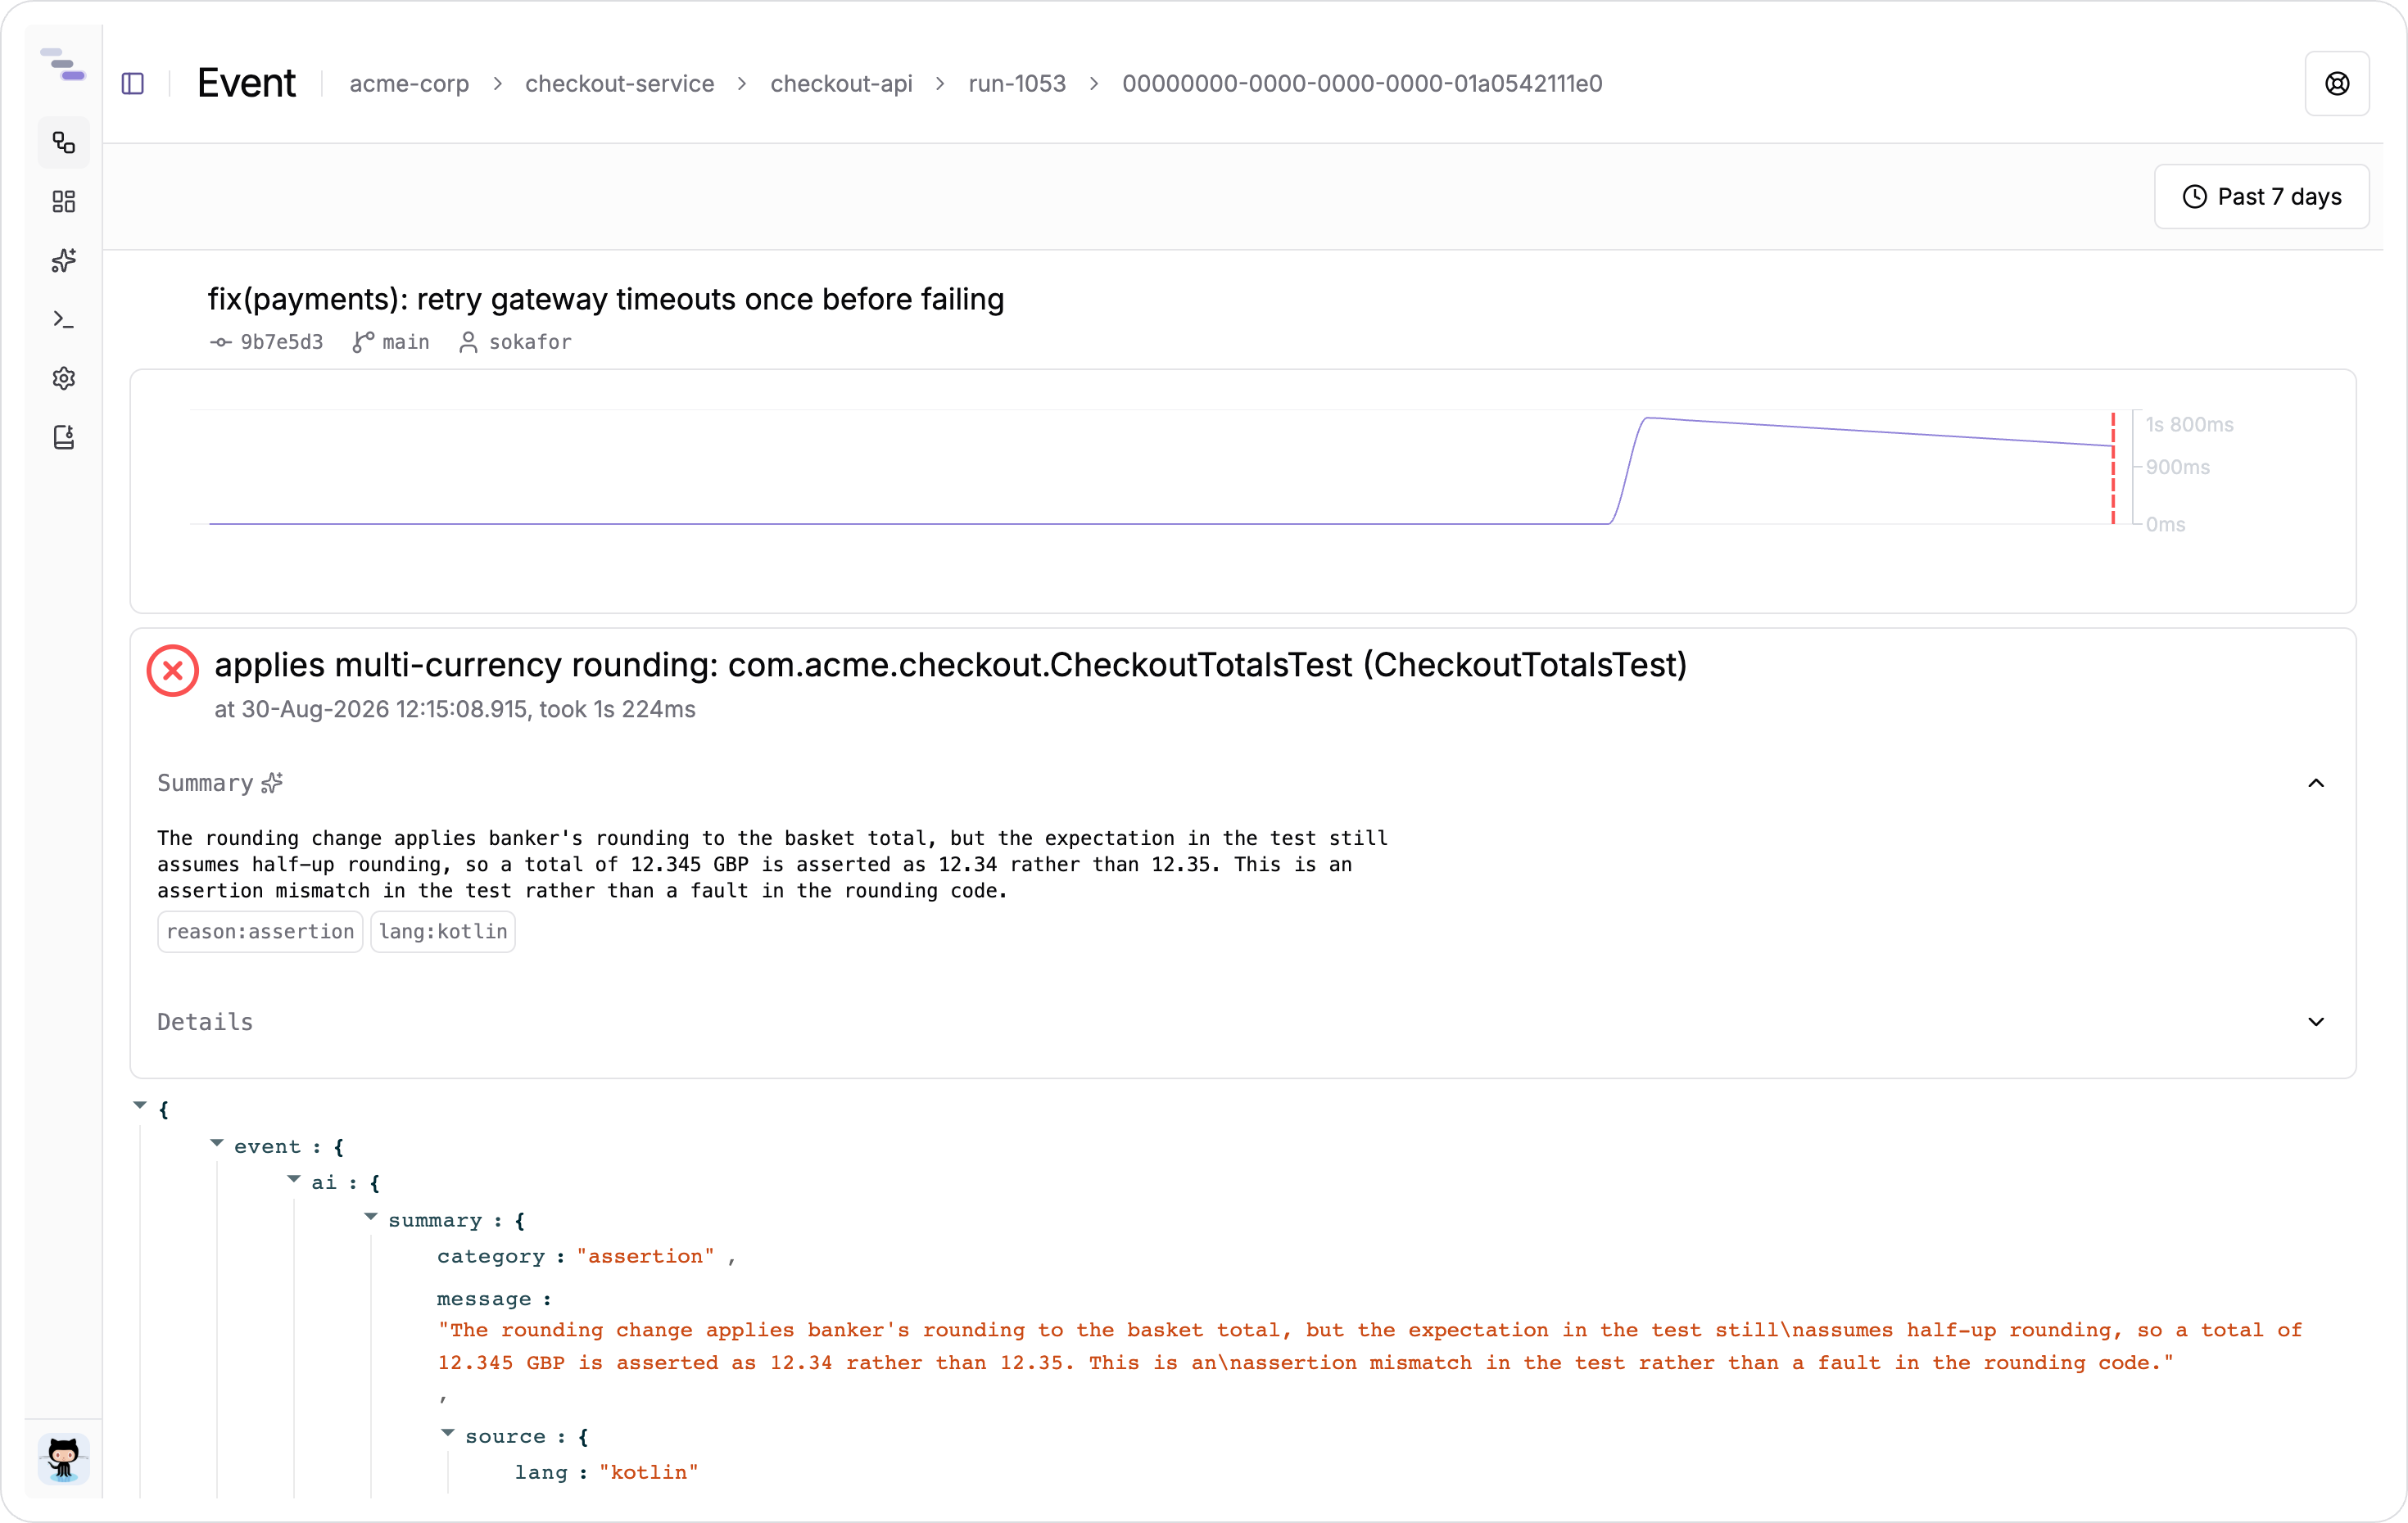
When a failure has been analysed by the AI summariser, the status panel opens on a Summary. It gives a short explanation of what went wrong, tagged with the failure reason and the language it was detected in. The raw message and stack trace stay one click away under Details, and the whole event is available as JSON underneath for anything the panels do not show. See AI Insights for how to switch summaries on.
A statistics chart plots the same event across earlier builds, which is how a slow test or an intermittent one gives itself away: a flat line that steps up on one date points at the change that did it. The commit that produced the event is shown alongside, and any attachments are listed beneath.
Attachments and file views
Files collected during a build are viewable in place rather than downloaded and opened elsewhere. The same viewer is used everywhere a file appears: in the event sheet, on an event page, and in the Files tab.
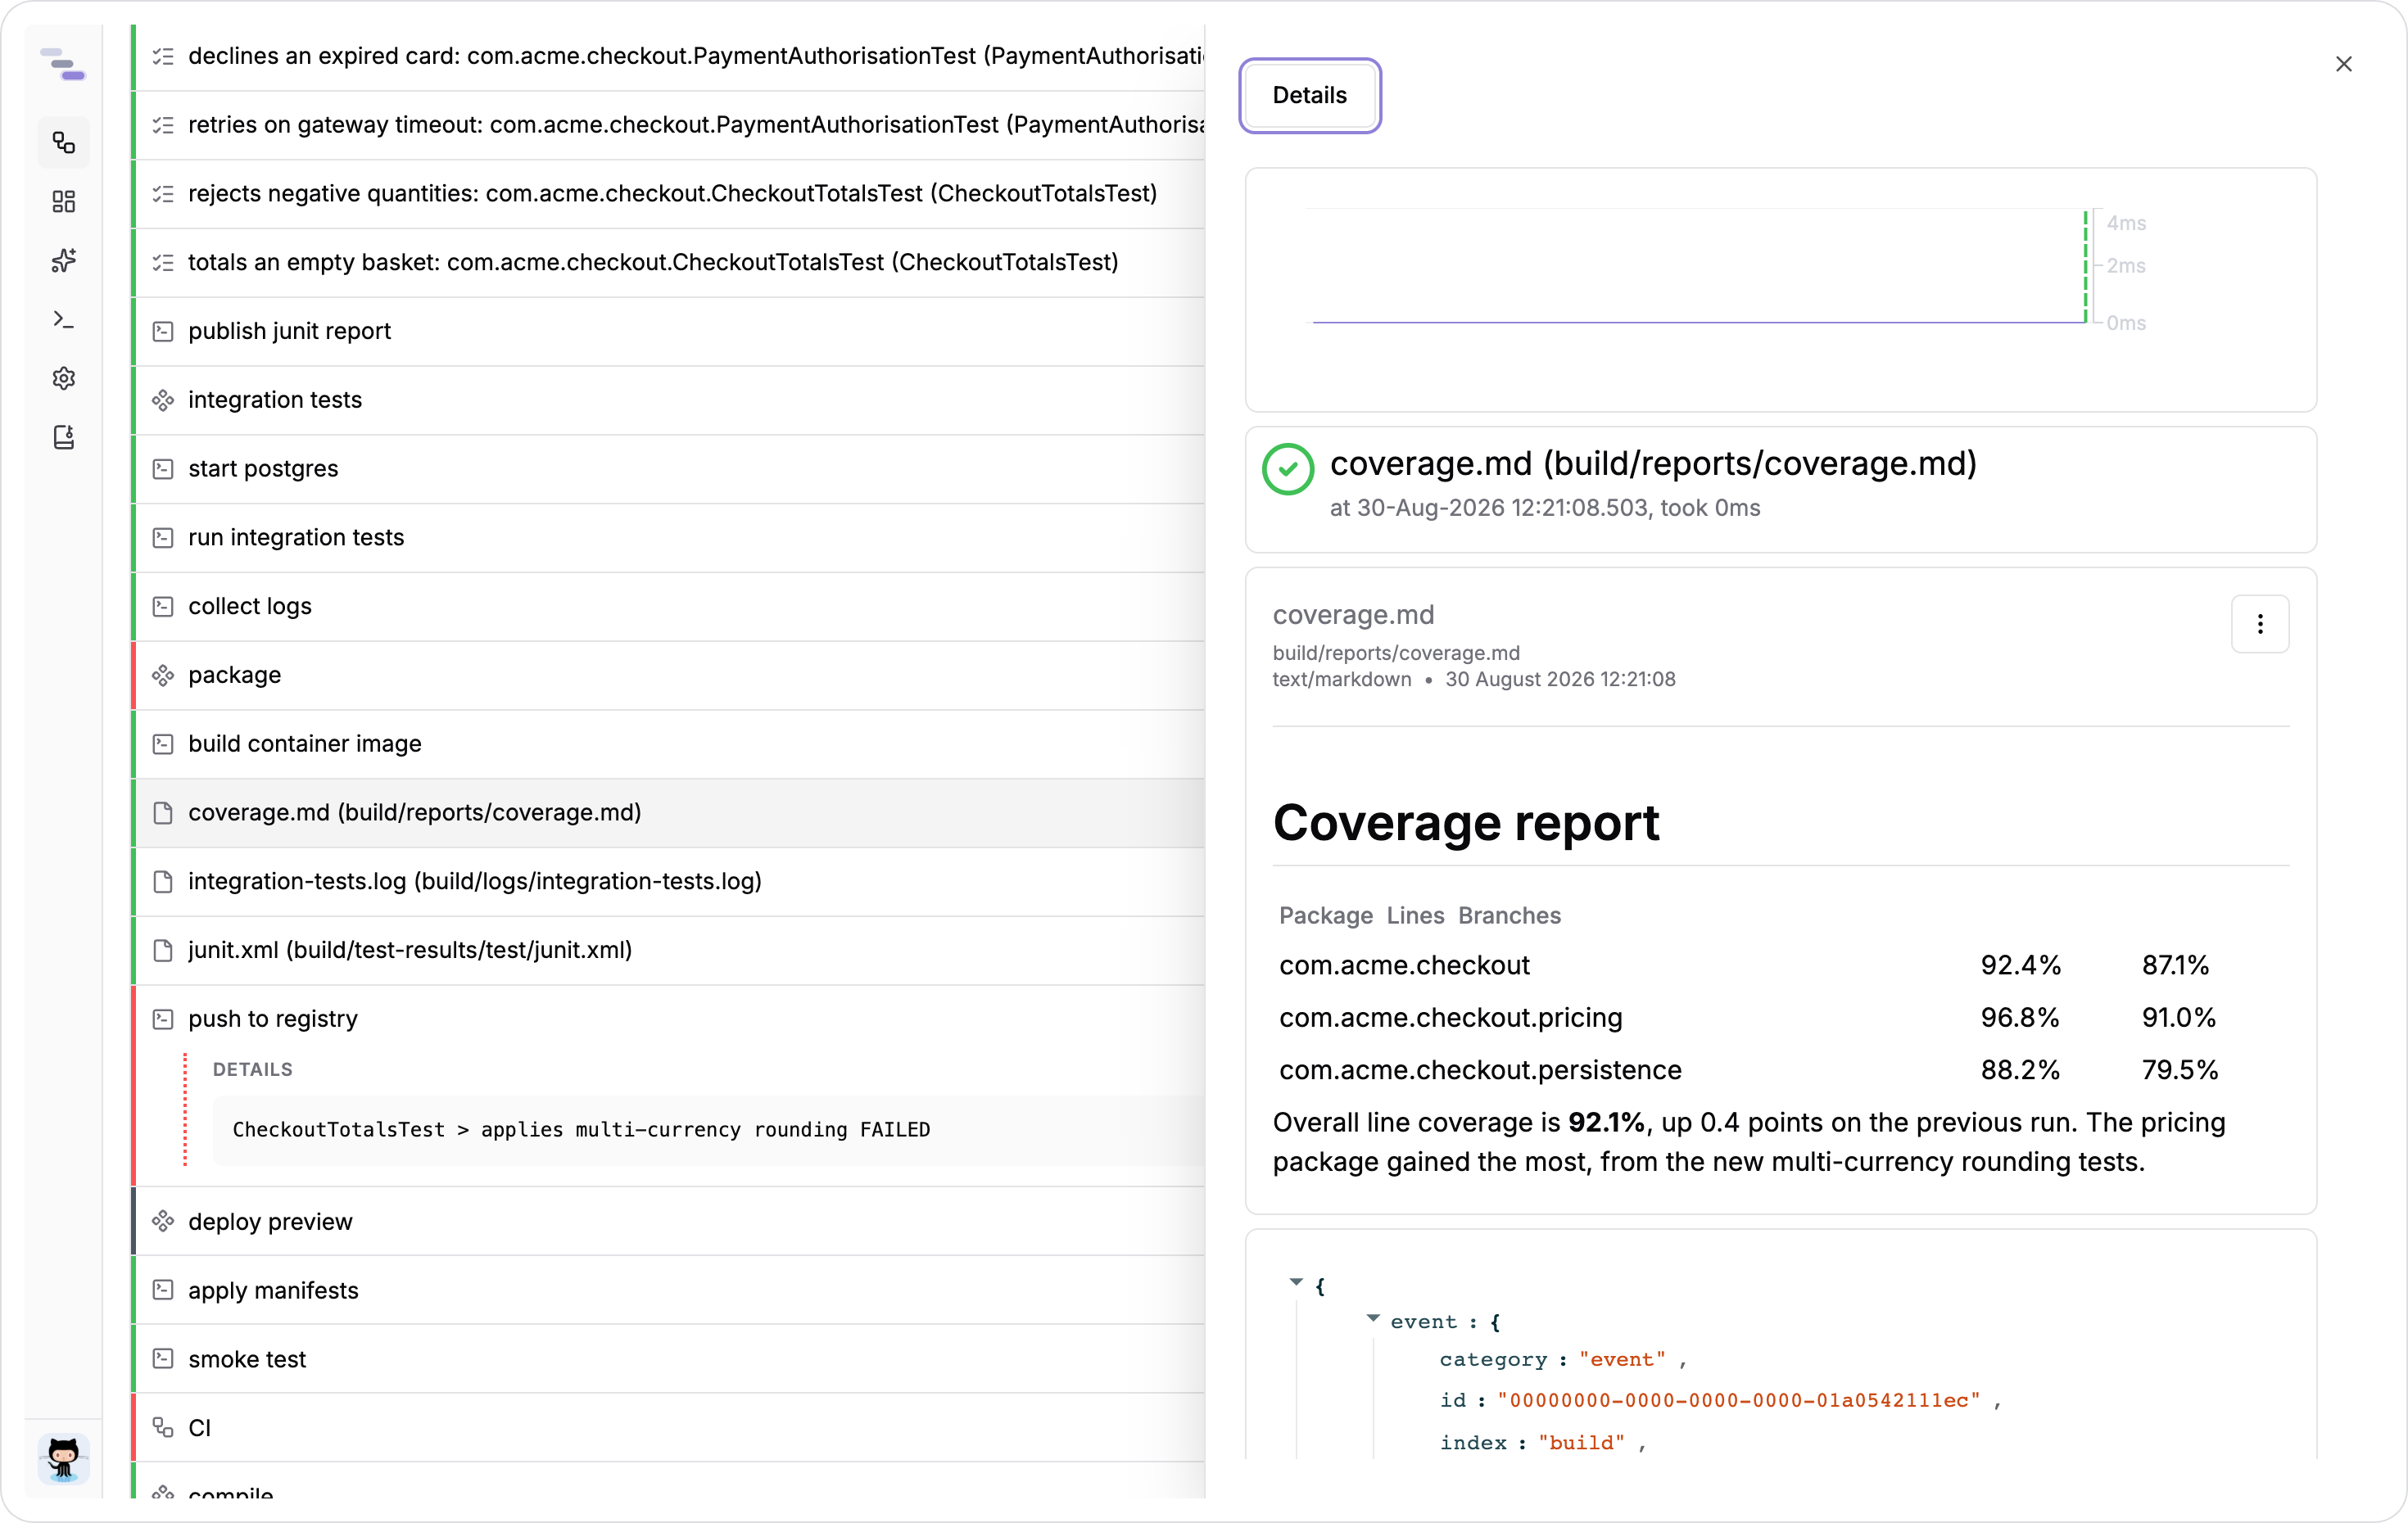
Every file carries a header with its name, the path it was collected from, its size, its content type, and when it was collected. The ⋮ menu beside that header downloads the original, whatever the type.
How the body renders depends on the content type, which the CLI assigns from the file extension at collection time:
| Files | Rendered as |
|---|---|
.png, .jpg, .gif, .svg, and other images | The image itself |
.mp4, .webm, and other video | An inline player with controls |
.mp3, .wav, and other audio | An inline player with controls |
.txt, .log, .conf, .list | Monospaced text, as-is |
.md, .markdown | Rendered Markdown |
.mmd, .mermaid | The drawn Mermaid diagram |
.json | An expandable JSON tree |
.oas.json, .oas.yaml, .openapi.json, .openapi.yaml, and their .yml equivalents | Browsable API documentation |
Anything else reports that a preview is not available. The file is still collected and still downloadable from the ⋮ menu, so an archive or a binary artefact is never lost, it is only not rendered.
Two of these are worth knowing about before you name your files. Links inside rendered Markdown resolve relative to the path the file was collected from, including ./ and ../ segments, so a report that links to a sibling page or embeds a sibling image works in the browser exactly as it did on the build agent. And an API specification is only recognised by its filename: api.openapi.yaml and api.oas.json render as documentation, whereas a plain api.yaml does not, and api.json falls back to the JSON tree.
Test results carry their system output and error streams as system-out.txt and system-err.txt attachments automatically, so console output for a failing suite is always one click from the failure.